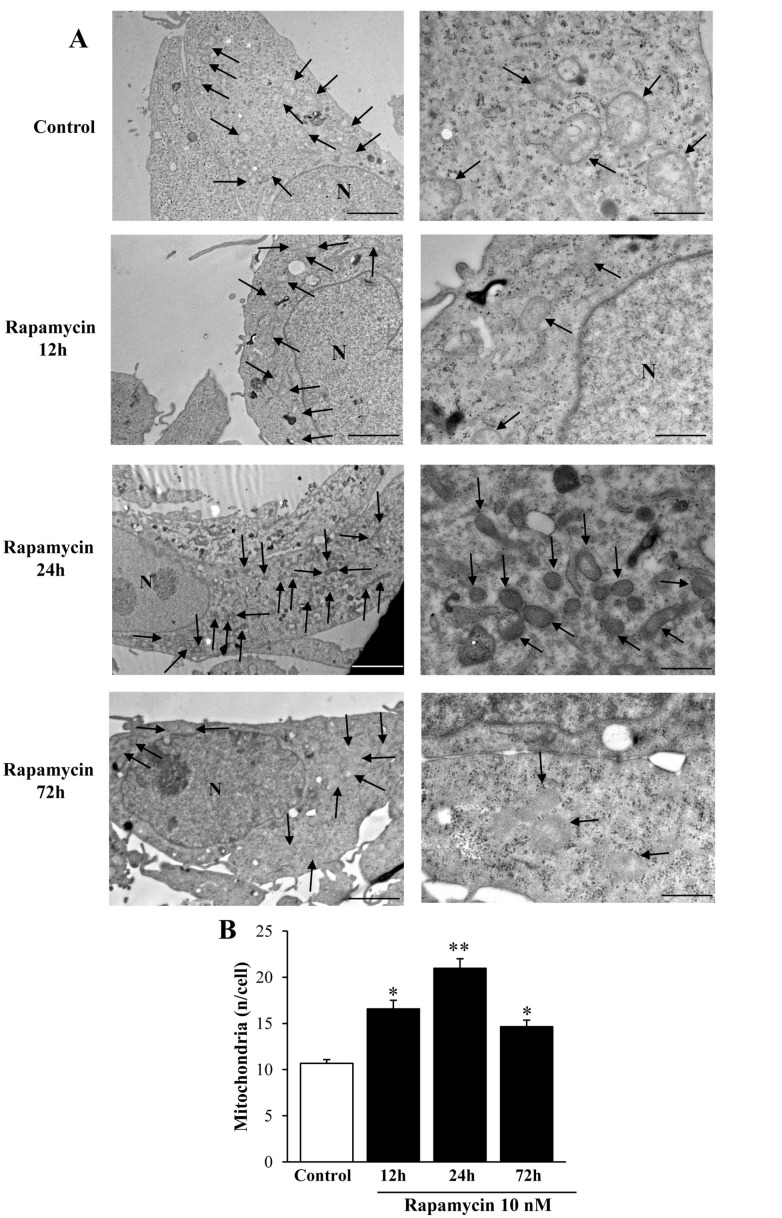
Figure 3.
Rapamycin time-dependently increases mitochondrial number in U87MG cell line. (A) Representative TEM micrographs showing mitochondria (indicated by black arrows) from Control and from different time of continuous rapamycin 10 nM exposure. (B) Graph reports the number of mitochondria per cell. Values are the mean ± S.E.M. from 50 cells per group. ∗ p ≤ 0.05 vs. Control; ** p ≤ 0.05 vs. other groups. Scale bars = 1 μm (low magnification) and 0.56 μm (high magnification).

