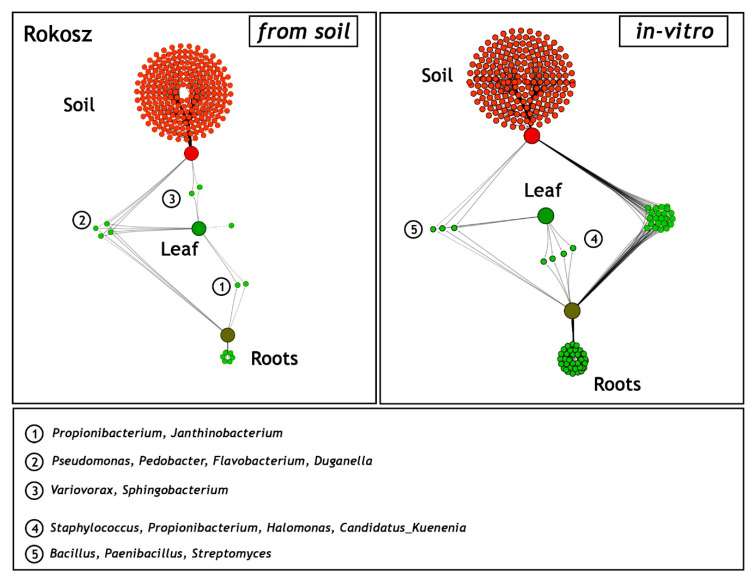
Figure 7.
Network-like Venn diagrams of the shared and unique genera in the three habitats: soil from the rhizosphere zone and the leaves and roots of Triticum spelta L. cv. Rokosz from the field (soil) and the in vitro experiment. The green lines represent the occurrence (single line) or the co-occurrence (multiple lines) of the bacteria (species) in each sample.

