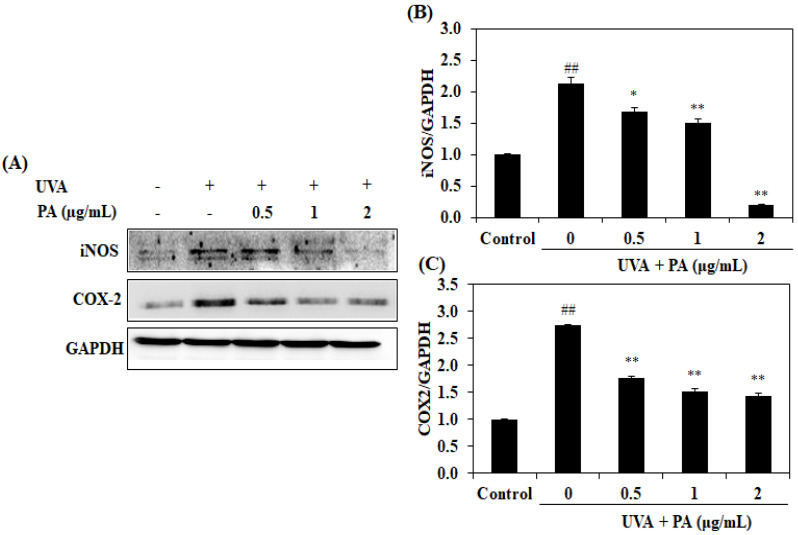
Figure 3.
Effects of PA on COX-2 and iNOS expression in UVA-irradiated HDF cells. The iNOS and COX-2 protein expression (A) and the relative (B) iNOS and (C) COX-2 protein expression levels. The levels were compared with GAPDH. The values are expressed as the mean ± SD in triplicate experiments. ## p <0.01 indicates a significant difference compared to the control groups. * p < 0.05 and ** p < 0.01 indicate a significant difference compared to the only UVA-irradiated groups.

