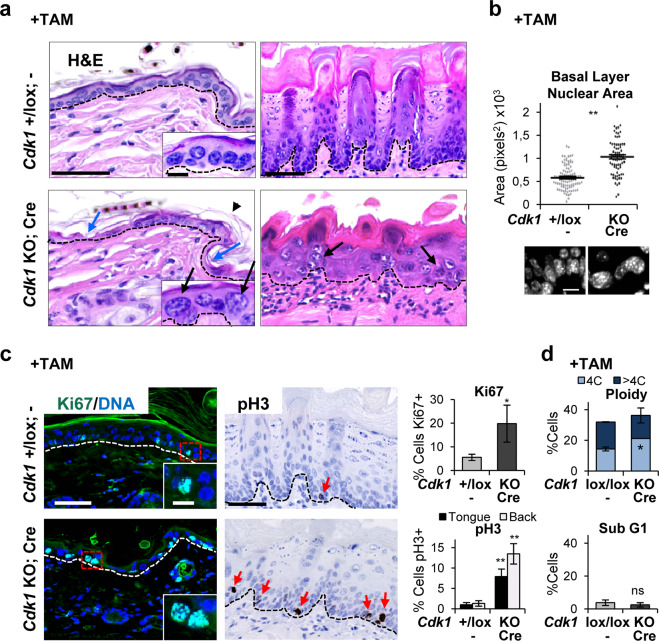
Fig. 1. Cdk1 knockout squamous epithelia display perturbed structure and large and polyploid basal nuclei.
a Representative hematoxylin/eosin (H/E) stain of the epithelium of back skin (left), or the tongue (right) in control mice (Cdk1+/lox; −) or KO mice (Cdk1 KO; Cre) upon TAM (8 days) treatment. Note the loss of cellularity (blue arrows) and the increase in nuclear size (black arrows) in the KO mice. b Histogram displaying the basal nuclear area of the epithelium of the tongue of mice as in a. Data are mean ± SD of representative immunofluorescence for DAPI (300 nuclei) as in the bottom. c Left: representative immunofluorescences for Ki67 of the epidermis (green; DNA in blue by DAPI) of mice as in a. Right: representative immunohistochemistry for pH3 of the tongue (brown; DNA in blue by hematoxylin) of mice as in a. Note the single pH3 positive cell in the control compared with the frequent positive cells in the KO epidermis (red arrows). Bar histograms: percent of Ki67 (top) or pH3 (bottom) positive cells. Data are mean ± SD of five representative fields (more than 500 nuclei). d Bar histograms for the percent of 4C (G2/M + tetraploids), >4C (polyploid), or sub-G1 cells (as measured by propidium iodide, PI) isolated from control mice (Cdk1lox/lox; −) or KO mice (Cdk1 KO; Cre) upon TAM (7 days) treatment. Broken line for the basement membrane. Scale bars: a, c 50 μm, d 10 μm; inset scale bar a, c 10 μm. **P < 0.01, *P < 0.05, ns not significant. Control mice do not have CRE recombinase (−). The results are representative of 2–3 animals per group (N = 2–3) and two independent experiments. See also Supplementary Fig. 2.

