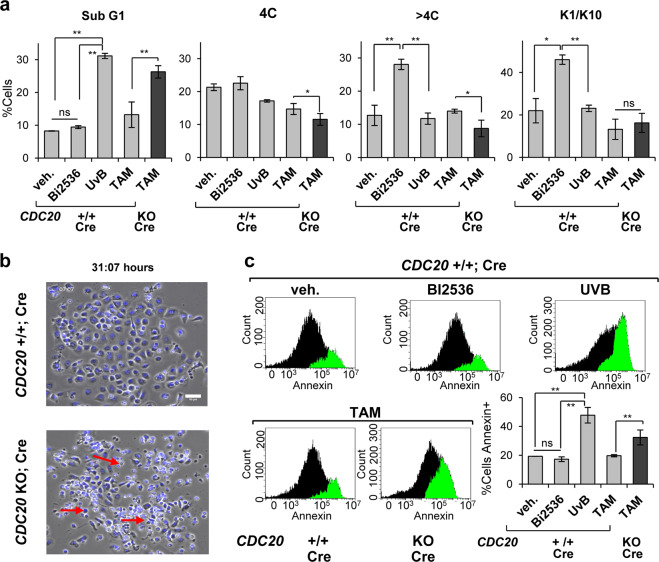
Fig. 7. Isolated CDC20 KO epithelial cells undergo apoptosis.
a Apoptotic sub-G1 fraction as measured by PI, in control cells (CDC20+/+; Cre), upon vehicle only (48 h), Plk1 inhibitor BI2536 (48 h), lethal UV irradiation (48 h) or TAM for 3 days, as indicated; black bar for CDC20 KO; Cre cells upon TAM treatment for 3 days. Percent of cells 4C (G2/M + tetraploids) and >4C (polyploids) 48 h after BI2536 or UV irradiation, or 4 days after TAM. Fraction of cells positive for squamous differentiation markers K1 and K10 48 h after BI2536 or UV irradiation, or 3 days after TAM. c Frame from a representative time-lapse video by phase-contrast microscopy and DNA labelling by NucBlue, 31 h after addition of TAM to delete CDC20. Scale bar: 50 μm. b Flow-cytometry analyses for detection of apoptotic early marker Annexin V after BI2536 (48 h), UV irradiation (48 h) or TAM (4 days). Bar histogram displays quantification of Annexin positive cells. **P < 0.01, *P < 0.05, ns not significant. Data are mean ± SD of duplicate or triplicate samples (n = 2 or n = 3) of at least two mice per group (N = 2) and five independent experiments. See also Supplementary Fig. 8.

