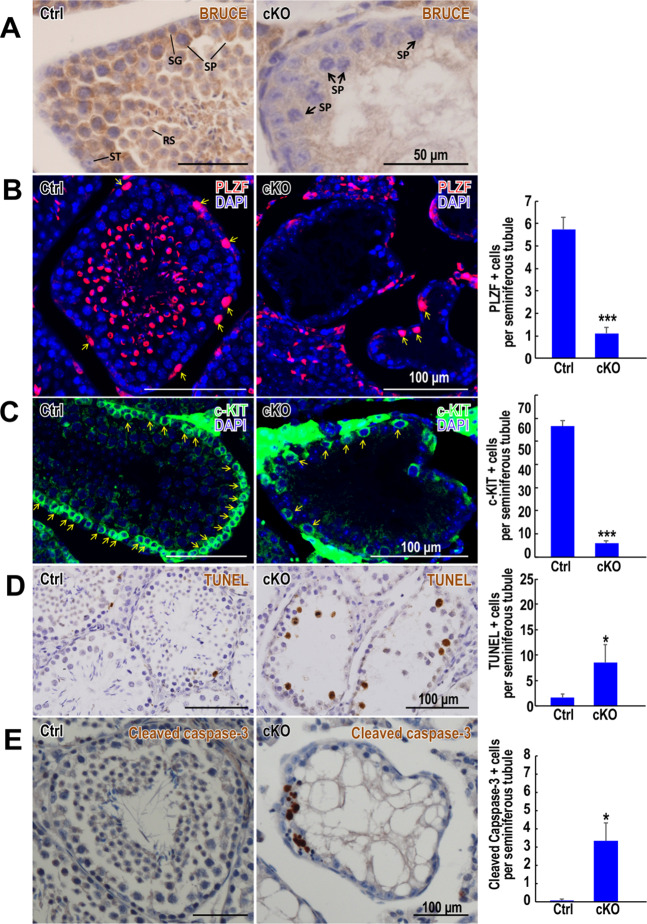
Fig. 2. Conditional inactivation of Bruce in mice results in apoptosis of germ cells.
a Immunohistochemistry (IHC) of Bruce confirms the high efficiency of Bruce KO. Arrows indicate spermatocytes devoid of Bruce protein expression in a cKO testis at 7 weeks of age. SG: spermatogonium; ST Sertoli cells; SP spermatocytes; RS round spermatids. Representative images from two independent Bruce Ctrl-cKO littermate pairs. b Immunofluorescence (IF) staining of Bruce Ctrl and cKO testis sections at 7 weeks of age with PLZF, a marker of undifferentiated spermatogonia. Arrows indicate PLZF-positive spermatogonia. Quantification of PLZF-positive cells is shown in a bar graph to the right. Data are aggregated from two independent Bruce Ctrl-cKO littermate pairs (tubules number, Ctrl = 35, cKO = 55). Error bar, standard error. Student’s t test, *p < 0.05. c IF staining of Bruce Ctrl and cKO testis sections at 7 weeks of age with c-KIT, a marker of differentiating spermatogonia. Arrows indicate c-KIT-positive (+) spermatogonia. Number of c-KIT + cells per tubule is shown in a bar graph to the right. Data are aggregated from two independent Bruce Ctrl-cKO littermate pairs (tubules number, Ctrl = 42, cKO = 45). Error bar, standard error. Student’s t test, ***p < 0.001. d Terminal deoxynucleotidyl transferase dUTP nick end labeling (TUNEL) staining of Bruce Ctrl and cKO testis sections at 7 weeks of age. Staining indicated increased numbers of TUNEL-positive cells in Bruce cKO. Quantification of TUNEL-positive (+) cells is shown in a bar graph to the right. Data are aggregated from three independent Bruce Ctrl-cKO littermate pairs (tubules number, Ctrl = 100, cKO = 55). Error bar, standard error. Student’s t test, *p < 0.05. e IHC of Bruce Ctrl and cKO testis sections at 7 weeks of age with Cleaved Caspase-3, a marker of apoptotic cells. Quantification of Cleaved Caspase-3-positive (+) cells is shown in a bar graph to the right. Data are aggregated from two independent Bruce Ctrl-cKO littermate pairs (tubules number, Ctrl = 13, cKO = 8). Error bar, standard error. Student’s t test, *p < 0.05.

