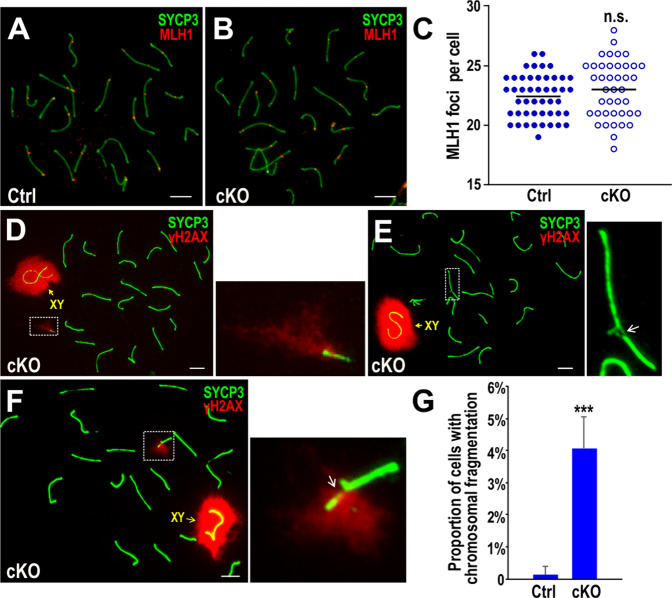
Fig. 4. Bruce cKO spermatocytes show chromosomal fragmentation and lateral axial damage.
a, b Chromosomal spread of Bruce Ctrl and cKO spermatocytes immunostained with SYCP3 (green) and MLH1 (red) antibodies. Representative images from three independent Bruce Ctrl-cKO littermate pairs. Bars, 5 µm. c Quantification of MLH1 foci in Bruce Ctrl and cKO mid-late pachytene spermatocytes. There is no statistical difference of MLH1 foci between Bruce Ctrl and cKO spermatocytes. Data are aggregated from three independent Bruce Ctrl-cKO littermate pairs. Horizontal line, mean. Student’s t test, n.s. not significant, p > 0.05. d Chromosomal fragmentation in Bruce cKO spermatocytes immunostained with SYCP3 (green) and γH2AX (red) antibodies. A representative Bruce cKO mid pachytene spermatocyte is shown to have 20 pairs of chromosomes plus one additional chromosome fragment associated with strong γH2AX immunofluorescence. The chromosomal fragment in the dashed rectangle is magnified to the right. Representative image from two independent Bruce Ctrl-cKO littermate pairs. Bar, 5 µm. (e, f) Chromosomal axial damage in Bruce cKO pachytene spermatocytes immunostained with SYCP3 (green) and γH2AX (red) antibodies. e A representative Bruce cKO mid pachytene spermatocyte is shown to have a chromosomal axial structure that is discontinuous and without γH2AX around the breaking point (white arrow). f A representative Bruce cKO mid pachytene spermatocyte is shown to bear a discontinuous axis as above, except with prominent γH2AX signals around the break point (white arrow). Chromosomal axial damage in the dashed rectangles are magnified to the right. Representative images from two independent Bruce Ctrl-cKO littermate pairs. Bars, 5 µm. g Frequency of chromosomal fragments and axial damage in Bruce Ctrl and cKO pachytene spermatocytes. Data are aggregated from two independent Bruce Ctrl-cKO littermate pairs (Ctrl, n = 441; cKO, n = 575). Error bar, standard deviation. Student’s t test, ***p < 0.001.

