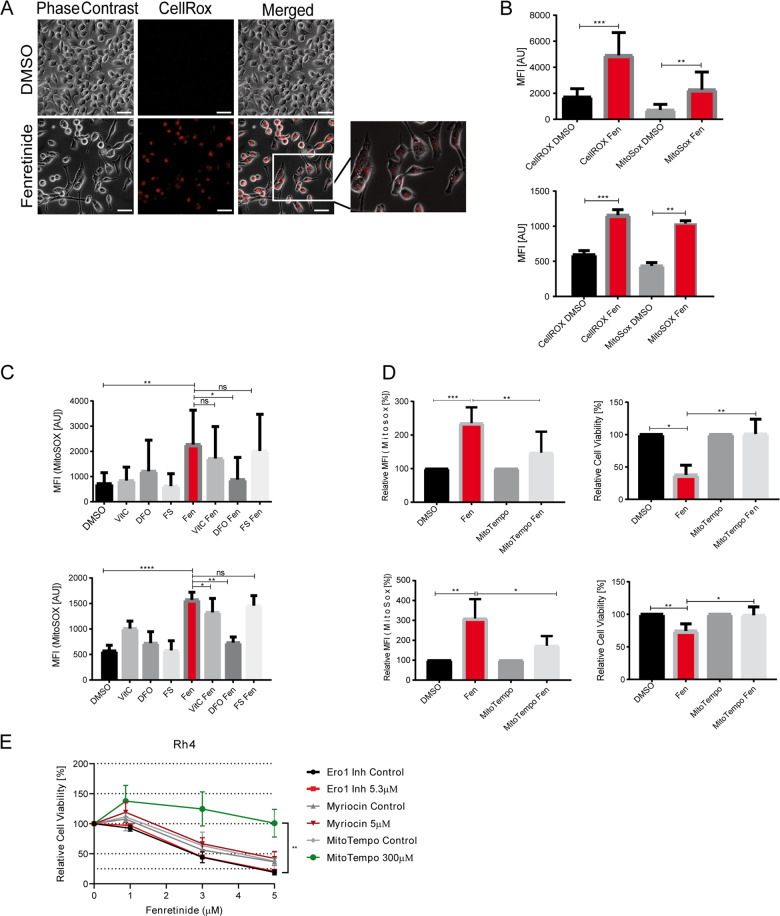
Fig. 2. Fenretinide triggers the production of reactive oxygen species.
a–d Fluorescence microscopy analysis and flow cytometry of fenretinide-treated Rh4 cells. a Light microscopy images of fenretinide (3 μM) treated Rh4 cells stained with a fluorogenic Pan-ROS detectant (4 μM CellRox). Scale bar is 50 μm. b Mean fluorescence index analysis of the flow cytometry data of Rh4 (upper panel) and Rh30 cells (lower panel) treated with fenretinide (3 and 4 μM, respectively). Cells were stained with 4 μM CellRox and 10 μM MitoSox for the detection of total ROS and mitochondrial ROS levels, respectively. c Mean fluorescence index analysis of the flow cytometry data of Rh4 (upper panel) and Rh30 (lower panel) cells treated with fenretinide (3 and 4 μM, respectively) and different ROS inhibitors including vitamin C (50 μM), deferoxamine (50 μM), and ferrostatin (4 μM). Cells were stained with MitoSox for the detection of mitochondrial ROS levels. d Mean fluorescence index of the flow cytometry data of ROS levels in Rh4 and Rh30 cells (upper and lower panel, respectively) after indicated treatments (left panel) and cell viability of Rh4 and Rh30 cells treated with fenretinide (3 and 4 μM, respectively) in the presence or absence of the mitochondria-specific ROS scavenger MitoTempo (300 μM) as determined by WST assay (right panel). e Cell viability of Rh4 cells treated with increasing concentrations of fenretinide in combination with different compounds including an inhibitor of the sphingolipid pathway (myriocin (5 μM)), an endoplasmatic reticulum stress inhibitor (Ero1 (5.3 μM)), and a ROS scavenger (MitoTempo (300 μM)).

