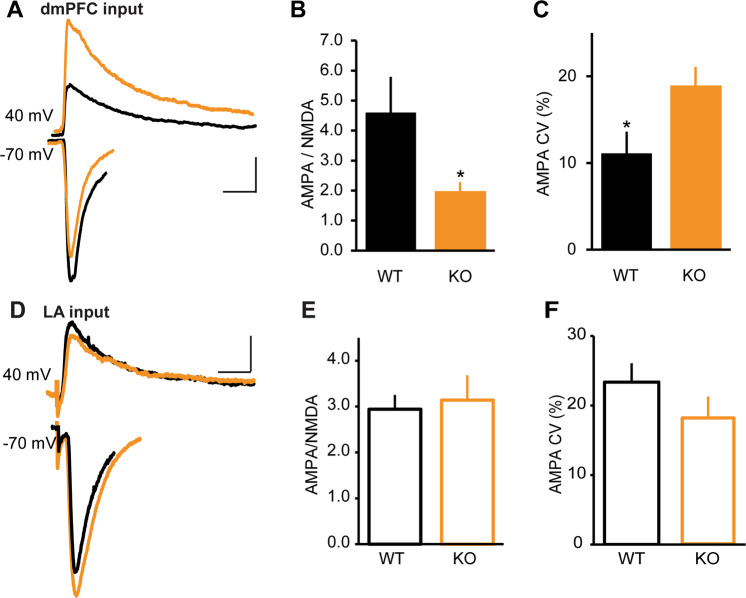
Fig. 2. Decreased AMPA/NMDA ratio at dmPFC–BA synapse in NRXN1α-KO mice.
a–c AMPA- and NMDA-mediated EPSCs at dmPFC–BA synapse. WT (n = 11 cells in 6 mice), KO (n = 12 cells in 6 mice). a Sample traces of light evoked AMPA receptor EPSCs at −70 mV and NMDA current measured at +40 mV, 40 ms after stimulation onset. Scale bars: 40 ms, 40 pA. b Decrease in AMPA/NMDA ratio in KO mice; *p < 0.05. c Stimulation intensity was adjusted to obtain comparable AMPA EPSC amplitudes in WT and KO mice. Increased AMPA EPSC coefficient of variation (CV) in KO mice; *p < 0.05. d–f AMPA- and NMDA-mediated currents at LA–BA synapse. WT (n = 13 cells in 6 mice), KO (n = 10 cells in 5 mice). d Sample traces of AMPA and NMDA EPSCs. Scale bars: 30 ms, 40 pA. e No difference in AMPA/NMDA ratio between WT and KO; p > 0.05. f No difference in AMPA EPSC CV between WT and KO; p > 0.05.

