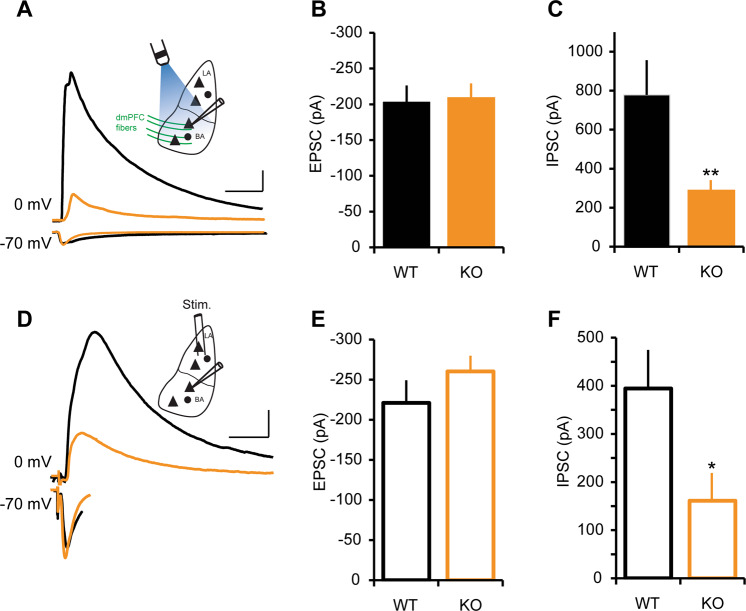
Fig. 3. Reduced inhibitory transmission in NRXN1α-KO mice.
a–c Inhibitory transmission in dmPFC–BA pathway. Stimulation intensity was adjusted to obtain comparable AMPA EPSC amplitudes in WT and KO mice and the consequent IPSC amplitudes were analyzed. EPSCs were recorded at −70 mV and IPSCs at 0 mV. WT (n = 13 cells in 7 mice), KO (n = 14 cells in 5 mice). a Representative traces of EPSCs and IPSCs from dmPFC–BA pathway in WT and KO mice. Inset: schematic diagram showing light activation of ChR2-expressing dmPFC fibers and whole-cell patch-clamp recording from a BA principal cell. Scale bars: 50 ms, 200 pA. b Normalize dmPFC-EPSC amplitude in WT and KO mice; p > 0.05. c Decreased IPSC amplitude in KO; **p < 0.01. d–f Inhibitory transmission in LA–BA pathway. WT (n = 13 cells in 5 mice), KO (n = 11 cells in 3 mice). d Representative traces of EPSCs and IPSCs recorded from LA–BA pathway in WT and KO mice. Scale bars: 50 ms, 100 pA. Inset: schematic diagram showing bipolar electrode stimulation of LA and whole-cell patch-clamp recording from a BA principal cell. e Normalize LA-EPSC amplitude in WT and KO mice; p > 0.05. f Mean IPSC amplitude is reduced in KO; *p < 0.05.

