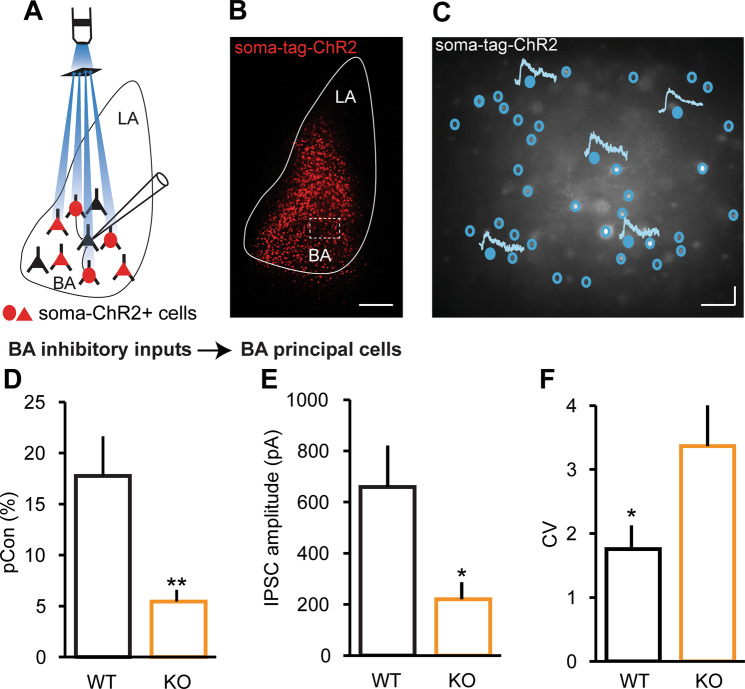
Fig. 4. Reduced inhibitory connections in NRXN1α-KO mice.
Local circuit mapping of inhibitory connections in the BA using digital micromirror device and soma-targeted ChR2. WT (n = 14 recorded cells in 6 mice), KO (n = 13 recorded cells in 6 mice). On average, 69 presynaptic neurons were stimulated per recorded (postsynaptic) neuron in WT mice, while 71 presynaptic neurons were stimulated per recorded (postsynaptic) neuron in KO mice. a Schematic diagram illustrating patterned light stimulation of soma-targeted ChR2-expressing cells while recording from a BA principal cell during circuit mapping. b Post-recording slice showing ChR2-expressing cells in the BA. Scale bar: 150 μm. c Sample traces of IPSCs recorded from BA principal neurons during circuit mapping. Filled circles represent ChR-expressing neurons that were stimulated and evoked a postsynaptic response in the recorded neuron, whereas empty circles represent ChR2-expressing neurons that were stimulated but no postsynaptic response. Scale bars: 100 ms, 50 pA. d Inhibitory connection probability is reduced in KO mice; **p < 0.01. e Mean IPSC amplitude is reduced, with concomitant increase in CV (f) in KO mice; *p < 0.05.

