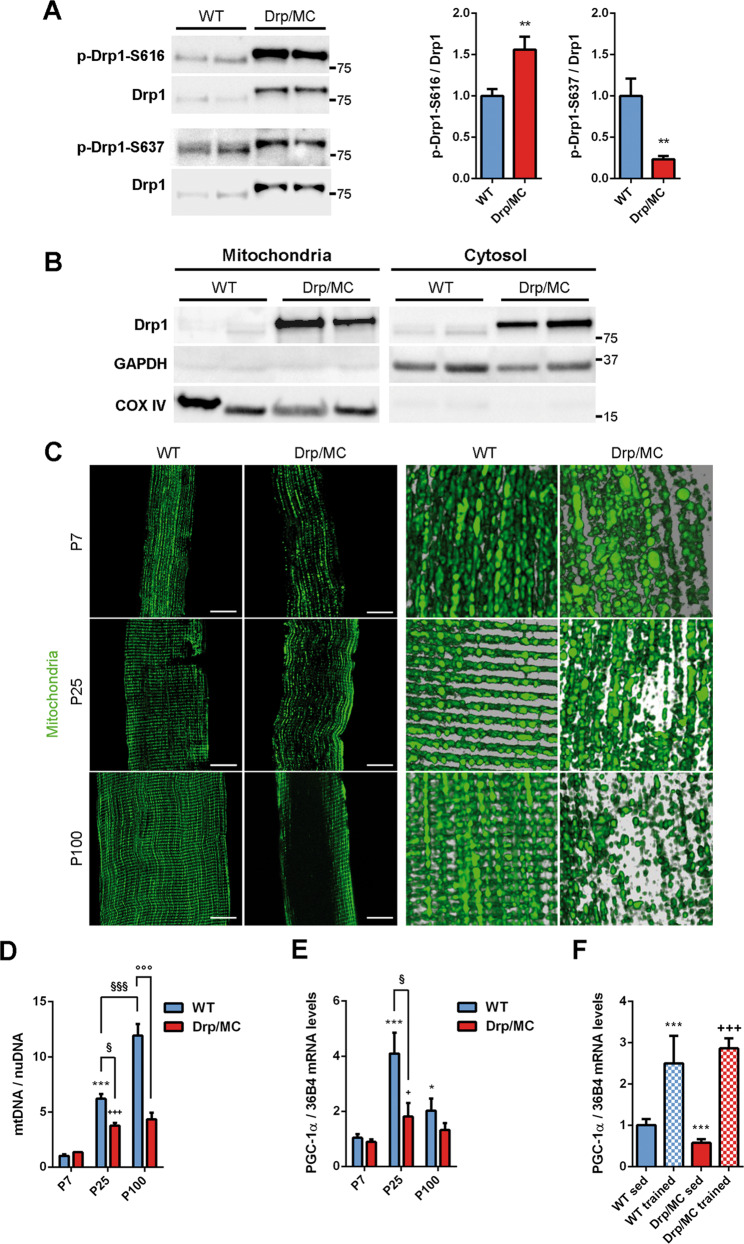
Fig. 1. Drp1 overexpression impacts on mitochondrial content, positioning and remodelling.
a Representative immunoblotting of phospho-Drp1 on serine 616 (p-Drp1-S616) and serine 637 (p-Drp1-S637) and total Drp1 in Tibialis Anterior (TA) lysates from WT and Drp/MC mice at P25. Phosphorylated Drp1 levels normalised on total Drp1 were quantified and shown as fold change of WT (n ≥ 7 mice per genotype). * vs WT (**P < 0.01). b Representative immunoblotting of Drp1 in mitochondrial and cytosolic fractions of TA from WT and Drp/MC mice at P25. COX IV and GAPDH have been used as mitochondrial and cytosolic markers respectively. c Confocal images (left) and magnified 3D reconstructions (right) of TA muscle fibres from WT/PhAM and Drp/MC/PhAM at P7, P25 and P100 showing mitochondrial network (green) (scale bar = 10 µm). d Quantitative PCR (qPCR) analysis of mtDNA content in TA from WT and Drp/MC mice at P7, P25 and P100. DNA levels were quantified and shown as fold change of P7 WT (n ≥ 3 mice per genotype). * vs WT at P7 (***P < 0.001); + vs Drp/MC at P7 (+++P < 0.001); § vs WT at P25 (§P < 0.05, §§§P < 0.001); ° vs WT at P100 (°°°P < 0.001). e Quantitative Reverse Transcription PCR (RT-qPCR) analysis of PGC-1α in gastrocnemius from WT and Drp/MC mice at P7, P25 and P100. Data are shown as fold change of P7 WT (n ≥ 4 mice per genotype). * vs WT at P7 (*P < 0.05, ***P < 0.001); +vs Drp/MC at P7 (+P < 0.05); § vs WT at P25 (§P < 0.05). f RT-qPCR analysis of PGC-1α in gastrocnemius from WT and Drp/MC mice at P100 either sedentary or trained. Data are shown as fold change of sedentary WT (n ≥ 3 mice per condition). * vs sedentary WT (***P < 0.001); +vs sedentary Drp/MC (+++P < 0.001). Values are expressed as mean ± SEM.

