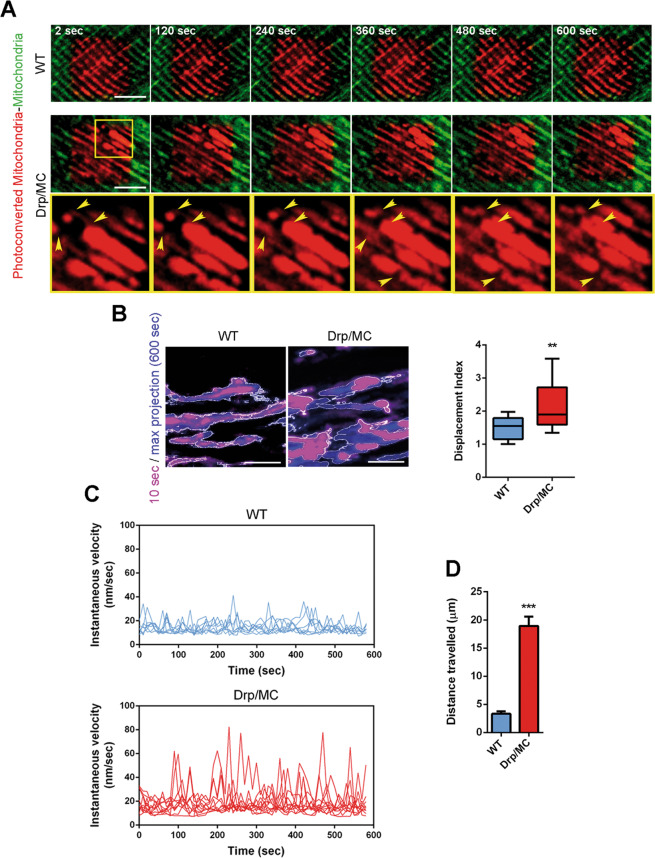
Fig. 2. Drp1 overexpression increases mitochondrial movements.
a Stills from the movie showing mobility of WT/PhAM and Drp/MC/PhAM mitochondria (TA). Arrowheads indicate mitochondrial movements during the time (scale bar = 5 µm). b Stills from movies showing the area occupied by mitochondria in WT and Drp/MC myotubes at 10 s (magenta) and after 600 s (blue) (scale bar = 5 µm). Displacement Index was calculated (n ≥ 3 independent experiments). * vs WT (**P < 0.01). c Instantaneous velocities of mitochondria in selected ROI were determined in WT and Drp/MC myotubes using Mytoe software (n ≥ 3 independent experiments). d Distance travelled by mitochondria in WT and Drp/MC myotubes calculated by ImageJ software (n ≥ 3 independent experiments n ≥ 20 mitochondria). * vs WT (***P < 0.001). Values are expressed as mean ± SEM.

