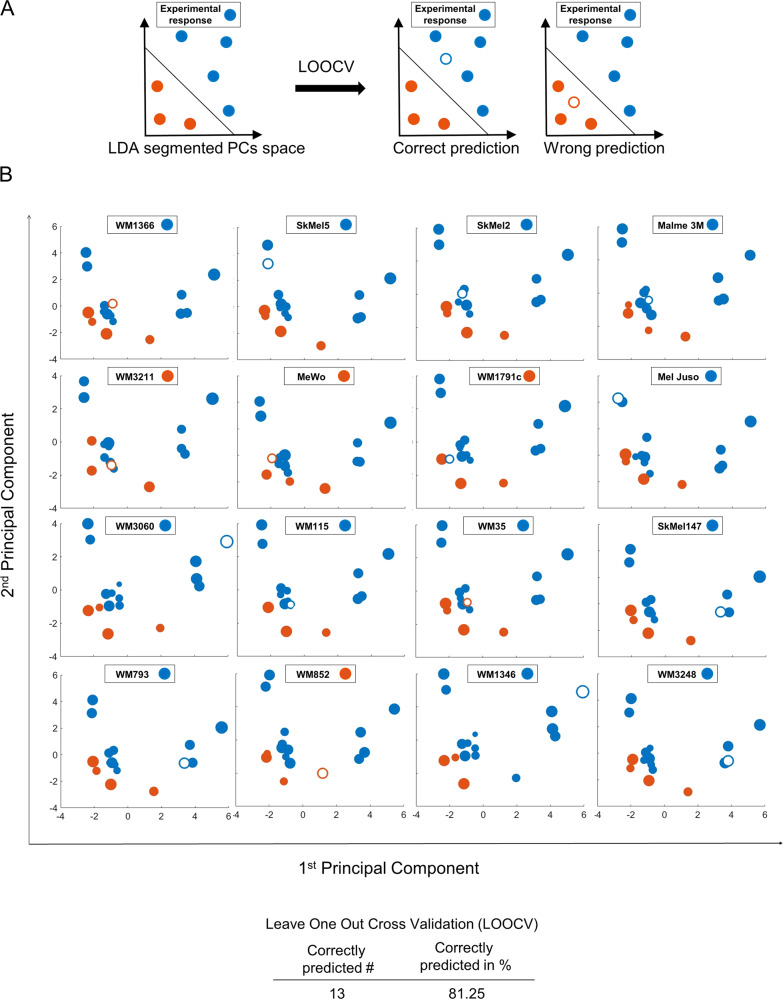
Fig. 3. Expression patterns of apoptosis proteins allow predicting IZI1551/Birinapant responsiveness.
a Simplified 2D schematic showing the workflow for determining prediction accuracy by combined PCA/LDA/LOOCV. Following PCA, an LDA separates the PC space into areas for synergistic responsiveness and low responsiveness. A cell line of unknown responsiveness (empty circle) is then placed into the segmented PC space according to its protein expression profile, with the positioning serving as the response prediction. Experimental responsiveness data served to validate predictions. b 2D projection of LOOCV results for the 16 cell lines. The responsiveness of the test cell line was predicted (blue for synergistic, orange for low responsive). The empty circle represents the test cell line being placed into the PC space. Circle sizes decrease with distance from the observer to aid 3D visualisation. Table insert summarises prediction accuracy.

