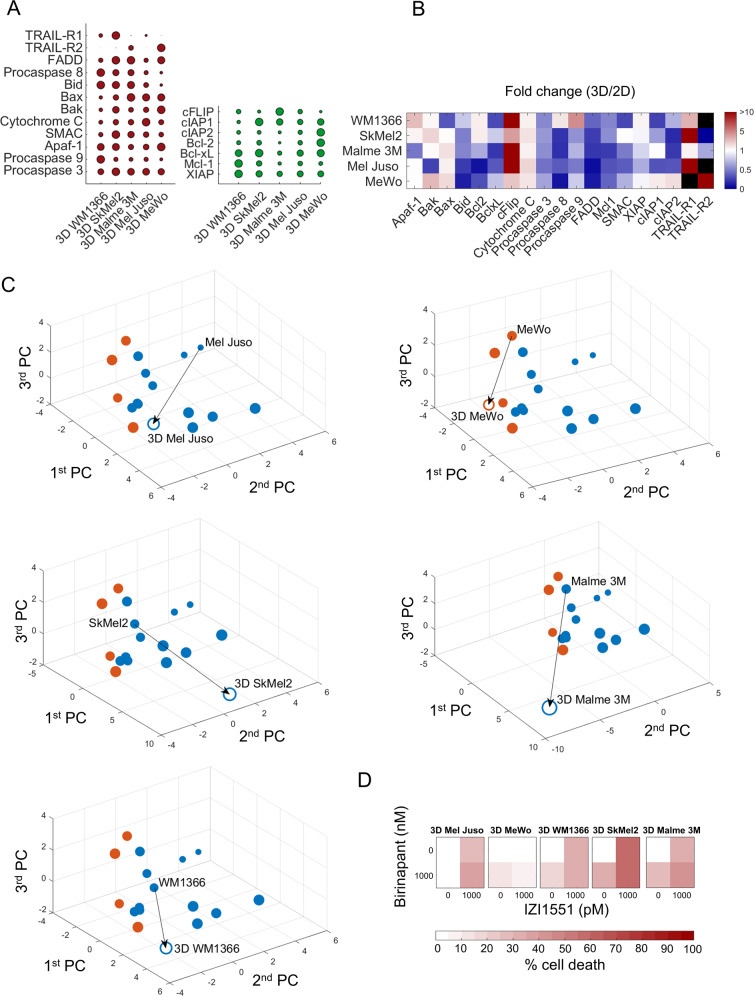
Fig. 4. Responses to IZI1551/Birinapant can be predicted for 3D growth conditions.
a Quantification of pro- and anti-apoptotic proteins in cell lines grown as MCTS (red and green, respectively). Circles summarise 285 quantifications and circle sizes represent mean protein quantities determined from at least n = 3 independent experiments. Protein amounts are provided in Supplemental table 1. b Heatmap showing the fold change in protein expression between 3D and 2D culture. Black colour indicates absence in either 2D or 3D conditions. c Positioning of cell lines grown in 3D in the PC space defined by 2D cultured cell lines. Empty circles indicate positions of cell lines grown in 3D. Arrows indicate the change of position in the PC space caused by altered protein expression between 2D to 3D growth conditions. Circle colours reflect expected responsiveness (blue) or resistance (orange), based on the LDA segmented PC space. The circle size decreases with distance from the observer to aid 3D visualisation. d Experimental validation of MCTS responsiveness to IZI1551/Birinapant treatment. MCTS of cell lines were treated with IZI1551 (1 nM) and Birinapant (1 µM) or their combination for 24 h. Cell death was measured by flow cytometry (PI uptake). Data show means of n = 3 measurements.

