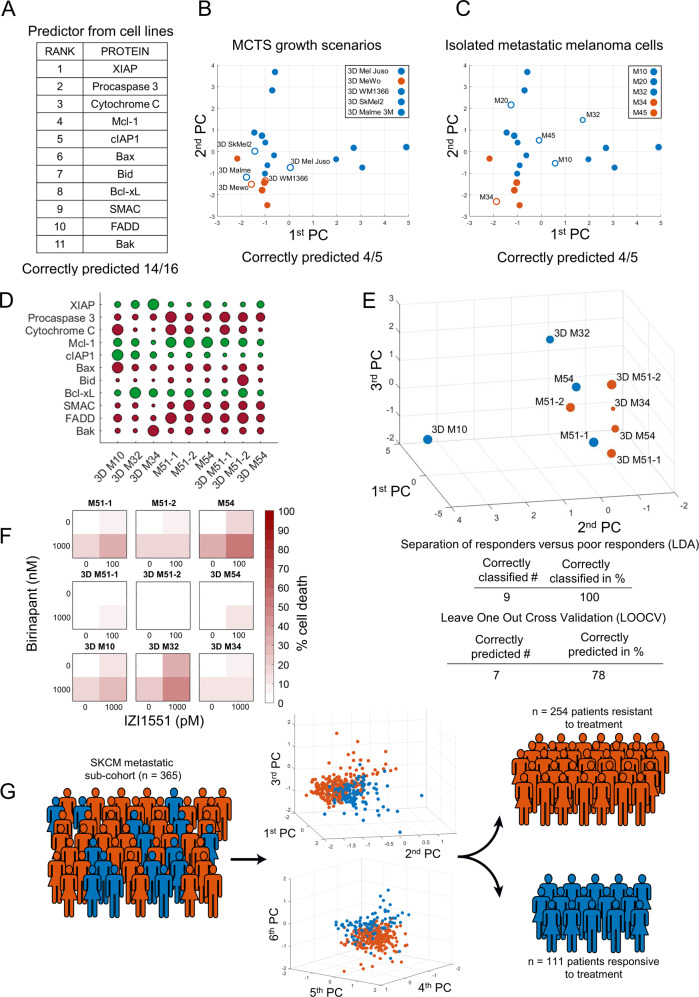
Fig. 6. A reduced predictor maintains performance and estimates response prevalence to IZI1551/Birinapant in metastatic melanoma.
a Ranking of variables in a reduced predictor, as obtained by computed merit. b, c Responsiveness predictions and prediction accuracies for MCTS growth scenarios and for metastatic melanoma cells isolated from patients. The PC space is shown as a two-dimensional projection. Filled circles represent training data from the melanoma cell line panel. Open circles highlight positions of MCTS (b) or cells isolated from melanoma metastases (c). d Quantities of apoptosis regulators in additional validation samples. Circle sizes represent relative protein amounts. Protein amounts are listed in Supplemental table 1. Western blots are shown in Supplemental Fig. 5. e Validation samples positioned in the PC space obtained by the reduced predictor. Colour-coding indicates responsiveness. Table inserts display accuracy of spatial segmentation and prediction accuracy. f Experimental responsiveness of validation samples. Cells were treated as indicated for 24 h. Cell death was measured by flow cytometry (PI uptake). Heat maps show the mean of n = 3 independent experiments. g Estimation of response prevalence in a hypothetical trial. Estimated protein expression profiles of metastatic melanoma patients (n = 365) were used to predict responsiveness (blue, n = 111) or resistance (orange n = 254) to IZI1551/Birinapant combination treatment. 3D graphs show arrangement of predicted responders and non-responders in the predictor space.

