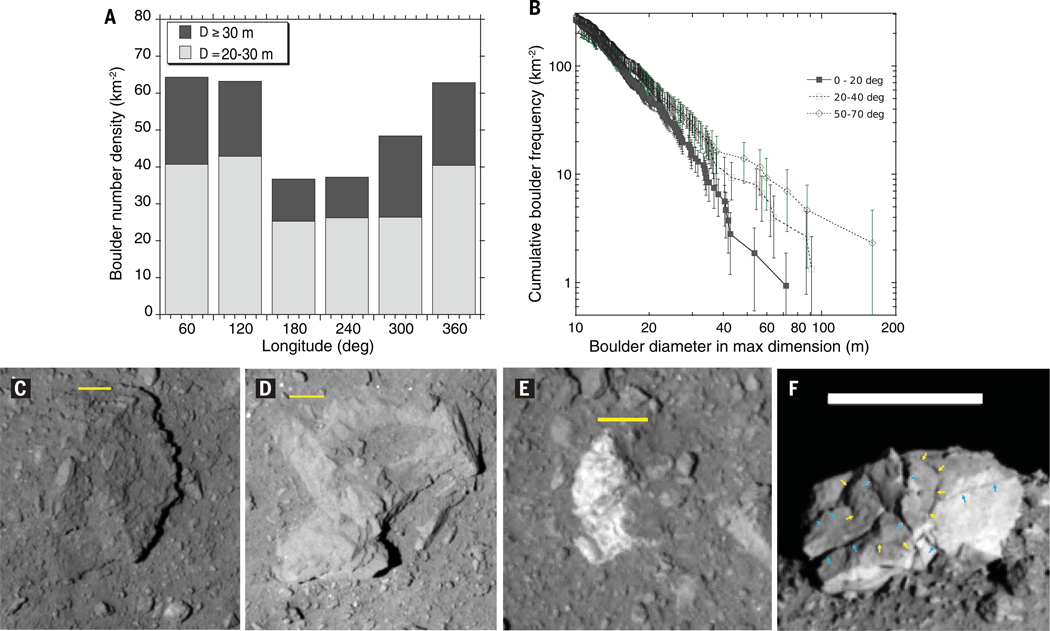
Fig. 4. Statistics and morphologies of boulders on Ryugu.
(A) Distribution in longitude of boulders with diameters of 20 to 30 m and ≥30 m. (B) Cumulative size distribution of large boulders, compared between different latitudinal zones. (C) A type 1 boulder, which is dark and rugged (hyb2_onc_20181004_042509_tvf_l2b). A close-up view of its layered structure is shown in fig. S11D. (D) A type 2 bright boulder with smooth surfaces and thin layered structure (hyb2_onc_20181004_012509_tvf_l2b). A close-up view of its layered structure is shown in fig. S11E. (E) A type 3 bright and mottled boulder (hyb2_onc_20180801_213221_tvf_l2b). (F) The sole type 4 boulder, Otohime Saxum, has concentric (yellow arrows) and radial (blue arrows) fractures, consistent with a fracture system generated by an impact (hyb2_onc_20180719_124256_tvf_l2b). In (C) to (F), the brightness of each image is stretched independently.The yellow and white scale bars are 10 and 100 m, respectively.

