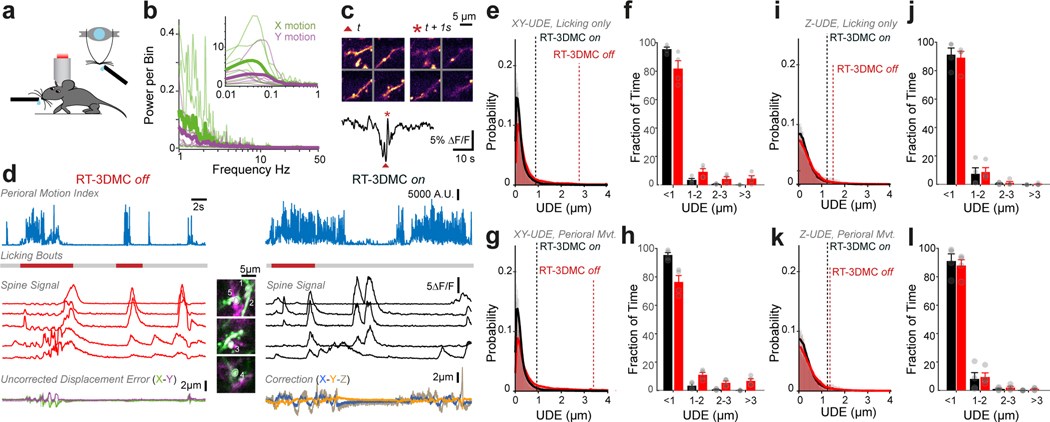
Extended Data Fig. 9. Brain movement and real time 3D movement correction during licking and perioral movements.
a: Cartoon of head fixed mouse and arrangement of water spout.
b: Power spectrum of X (green) and Y (purple) motion of the motor cortex during licking bouts. Green and purple thin lines show the average per mouse and the thick green and purple lines show averages across 6 mice. The inset shows frequencies of < 1 Hz.
c: Top: Images of 4 dendrites (15×15 μm) at two timepoints (red star and triangle) during a licking bout illustrating process moving out of focus. Bottom: Average tdTomato signal from the dendrites show intensity fluctuations during licking bout.
d: GCaMP6f recordings during licking bouts. Top: Motion index extracted from the perioral region (blue trace). Visually identified licking bouts (red lines below). Centre: GCaMP6f florescence extracted from active spines (grey ROIs in the middle, GCaMP6f in green, TdTomato in magenta) with RT-3DMC off (left, red) or on (right, black). Bottom: XY UDE (for RT-3DMC off, purple and green lines; left) and RT-3DMC (X, Y, Z blue, orange, grey, respectively; right) indicates the amount of brain movement during periods of licking (1 of 4 mice).
e: Distribution of XY UDE values with RT-3DMC on (black) or off (red) and mean (thick lines) during periods of licking (n=13 experiments, 4 mice). Dotted lines indicate the distance below which 95% of the values are located.
f: Similar to e but grouped into 1 μm bins to quantify large infrequent movements. With RT-3DMC, 95.6% of timepoints have a residual error of < 1 μm whereas only 81.9% without (n=4 mice, mean± SEM). Grey circles indicate individual measurements.
g: Same as e for XY UDE during all perioral movements (n=4 mice).
h: same as f for XY UDE during all perioral movements. With RT-3DMC, 95.2% of timepoints have a residual error of < 1 μm whereas only 76.3% without. (n=4 mice, mean± SEM). Grey circles indicate individual measurements.
i: Same as e for Z UDE during all licking (n=4 mice).
j: same as f for Z UDE during licking movements. With RT-3DMC, 91.4% of timepoints have a residual error of < 1 μm whereas 89.3.% without. (n=4 mice, mean± SEM). Grey circles indicate individual measurements.
k: Same as g for Z UDE during all perioral movements (n=4 mice).
l: same as h for Z UDE during all perioral movements. With RT-3DMC, 91.0% of timepoints have a residual error of < 1 μm whereas 87.8.% without. (n=4 mice, mean± SEM). Grey circles indicate individual measurements.

