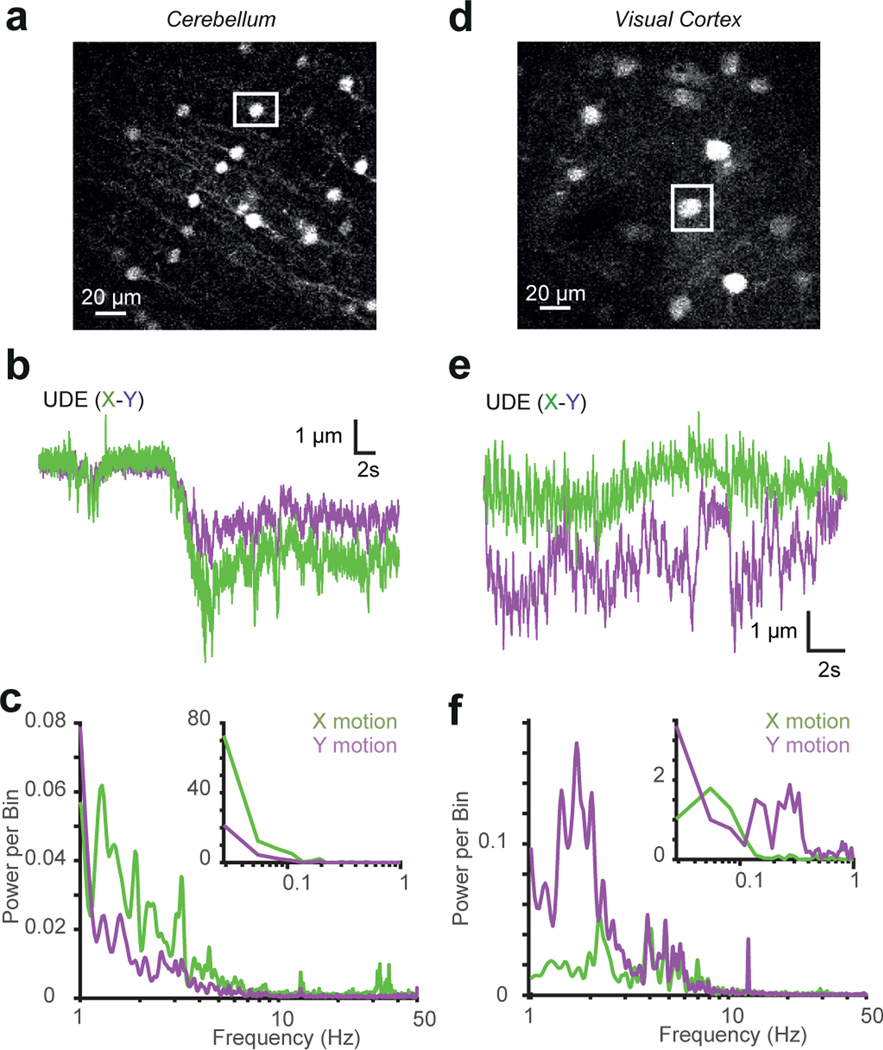
Extended Data Fig. 3. Characterisation of XY movement and frequency spectrum of brain movement.
a: Image of cerebellar molecular layer interneurons expressing GFP used to determine brain movement. The white square shows the selected soma that was used as a reference.
b: X (green) and Y (purple) movement of soma. X-axis is roughly aligned to the rostral-caudal plane (similar results were obtained from 9 experiments on n=1 mice).
c: Power spectrum analysis of X (green) and Y (purple) motion of cerebellum from head-fixed mouse free to run on a treadmill. Inset shows frequencies of < 1 Hz (similar results were obtained from 9 experiments on n=1 mice).
d: Image of pyramidal cells in L2/3 of visual cortex expressing tdTomato. The white frame shows a soma used to track movement.
e: as for b but for visual cortex (similar results were obtained from 13 experiments on n=1 mice).
f: As for c but for visual cortex (similar results were obtained from 13 experiments on n=1 mice).

