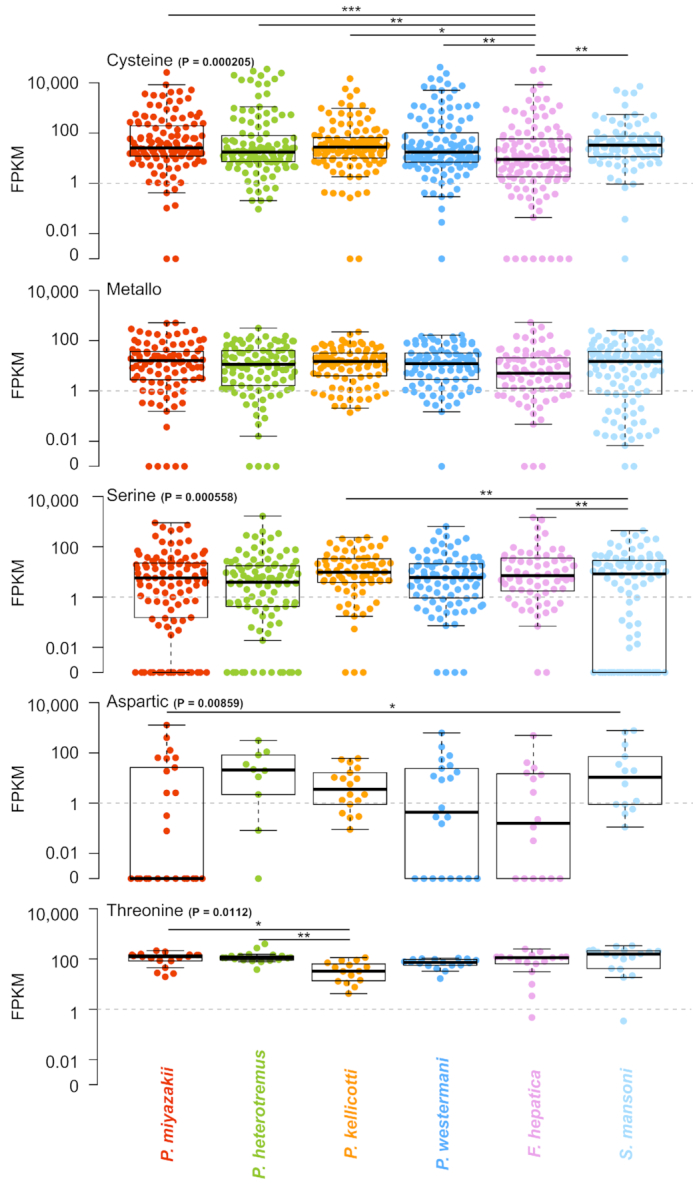
Figure 9:

A comparison of adult-stage protease gene expression levels in the 4 Paragonimus species, F. hepatica, and S. mansoni. Boxes represent the interquartile ranges (IQRs) between the first and third quartiles, and the line inside the box represents the median value. Whiskers represent the lowest or highest values within values 1.5 times the IQR from the first or third quartiles. ANOVA P values are shown, and significant pairwise T-test comparisons are indicated with lines (* P ≤ 0.05, ** P ≤ 0.01, *** P ≤ 0.001).
