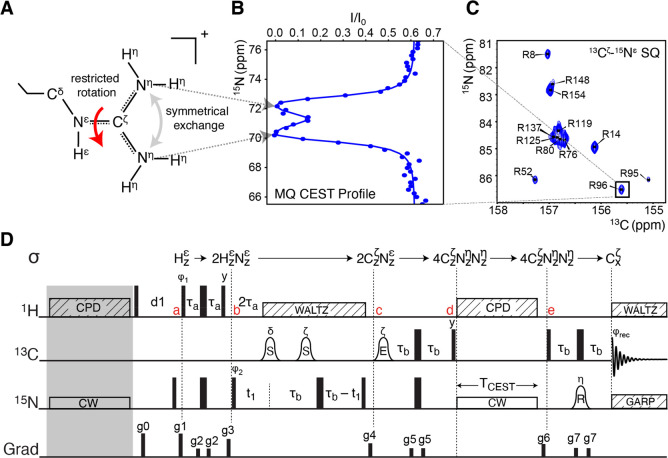
Figure 1.
(A) Illustration of an arginine side chain and the restricted rotation about the Cζ–Nε bond that causes the symmetrical exchange of the two 15Nη nuclei. (B) Example of a 15Nη–15Nη MQ-CEST profile, recorded for the R96 arginine in the L99A mutant of T4 lysozyme (T4L99A). The position of the two dips shows the 15Nη chemical shifts, and a least-squares fit to the profile provides the rate of exchange. (C) Example of a 13Cζ–15N correlation map for T4L99A that encodes the CEST profiles. (D) Pulse sequence derived for the MQ-CEST experiment applied to arginine side chains. The carrier frequencies are set to 7.15 ppm (1H), 157 ppm (13C), and 84 ppm (15N). Narrow and wide bars denote 90° and 180° pulses, respectively, with all pulses applied along x unless otherwise indicated. The bell shapes denote frequency-selective pulses, with the letter above showing selectivity and letter inside indicating the type: S refers to a Seduce shape,24 E to an EBURP shape, and R to a REBURP shape.25 Striped boxes indicate decoupling with the text indicating the scheme used. CW: continuous wave applied at CEST offset frequency. The delays are τa = 1/(4JHN)= 2.7 ms and τb = 1/(4JNC) = 12.5 ms. The phase cycle used is ϕ1 = x, −x; ϕ2 = 2(x), 2(−x); and ϕrec = x, −x, −x, x. Gradients are used to remove artifacts (full details in the caption to Figure S4).

