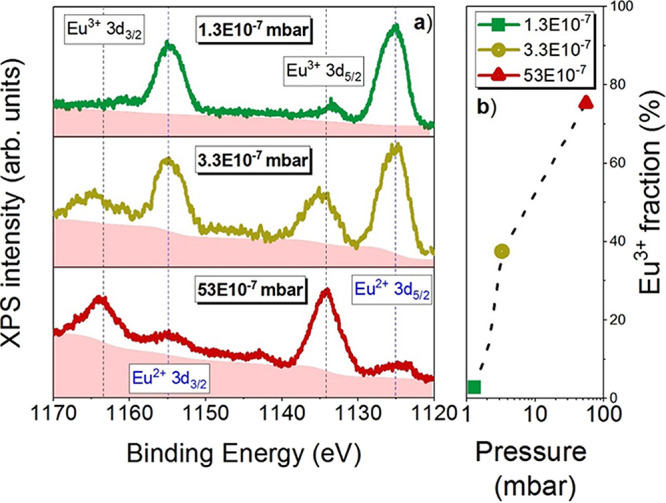
Figure 1.

(a) XPS 3d spectra: Eu2+ and Eu3+ contributions are marked by dashed lines. The pink shadow area represents the signal background. (b) Eu3+ relative percentage fraction in the logarithmic scale for films grown at 1.3, 3.3, and 53 (·10–7 mbar).
