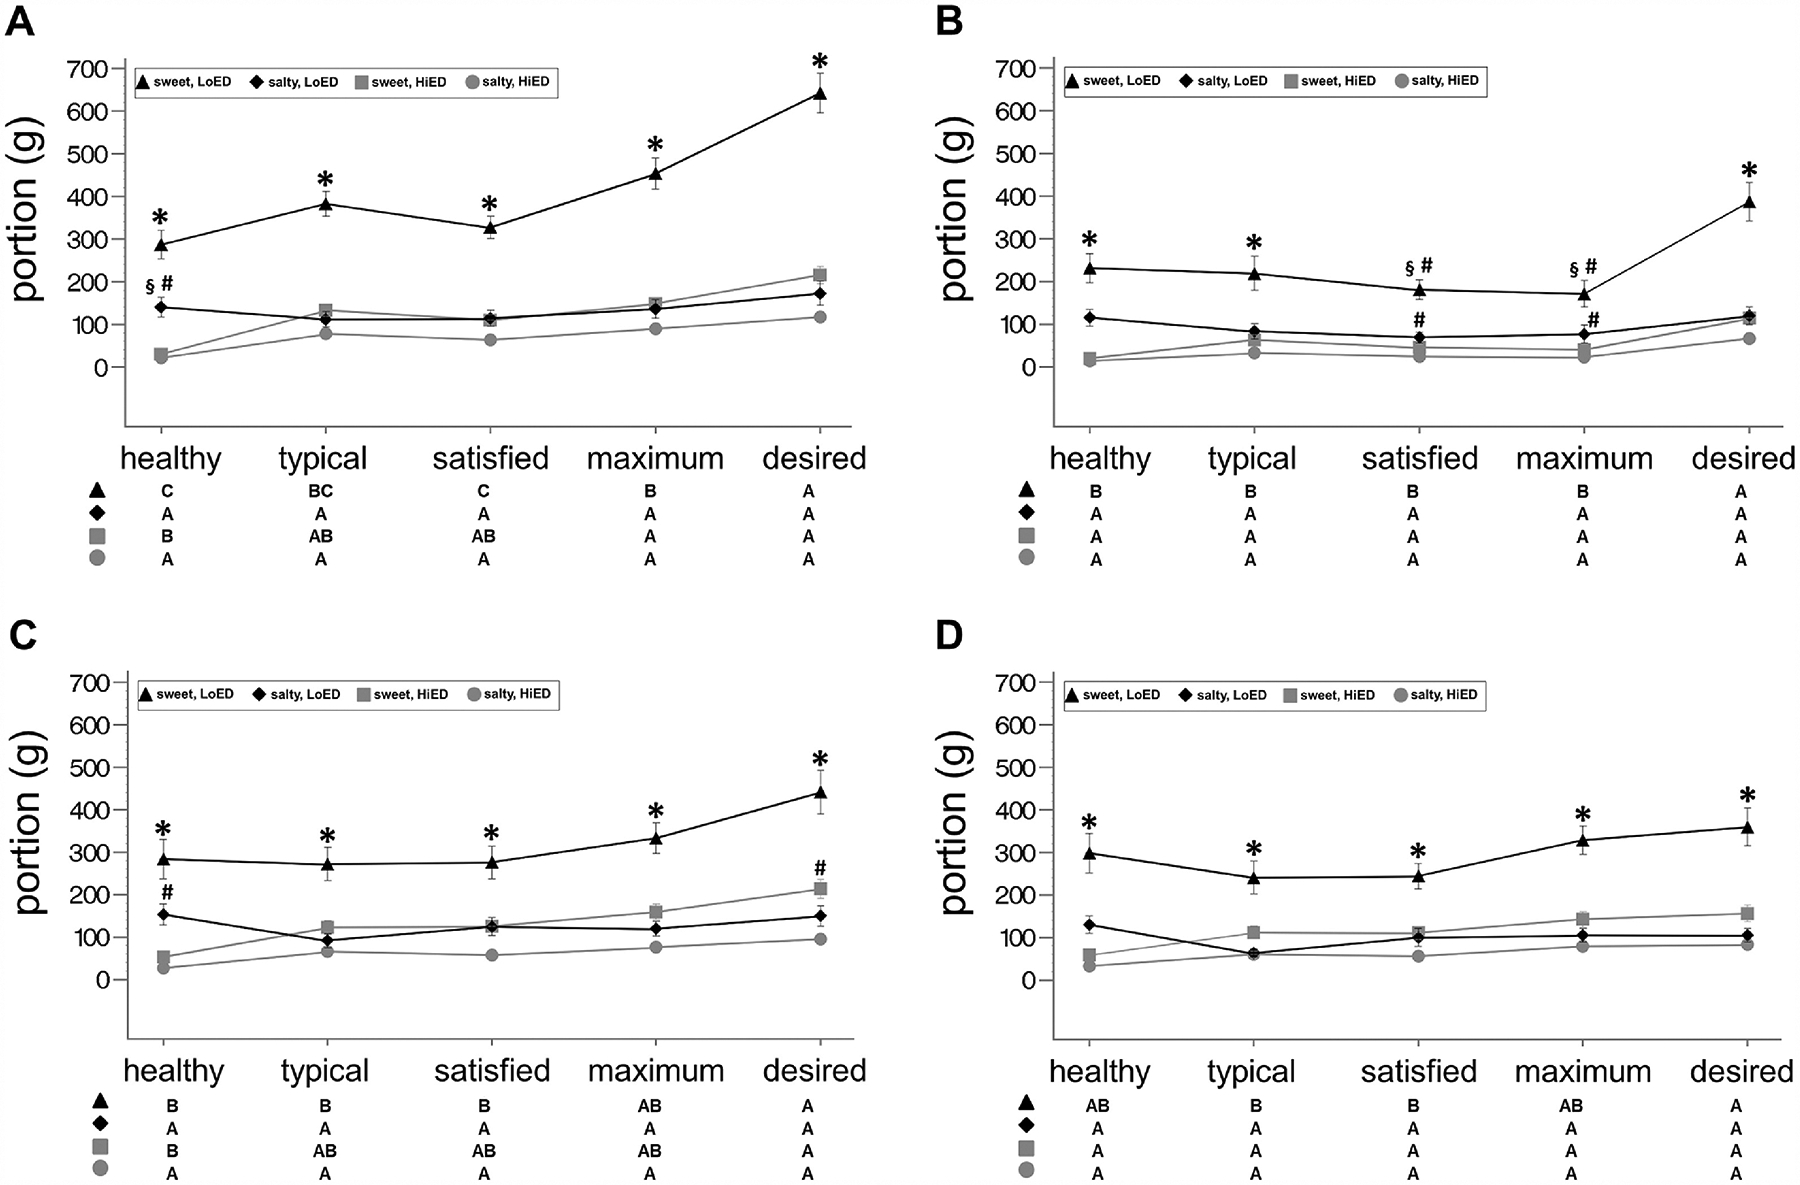
Figure 3. Portion means of each snack type across eating contexts.

Line graphs of portion means ± SEM across eating contexts (x-axis) for each of the four snack types (lines) in (A) patients (n = 29) at baseline (B) patients at follow-up, (C) controls (n = 29) at baseline, and (D) controls at follow-up. See Supplemental Table 1 and 2 for portion means ± SEM, Supplemental Table 4 for differences between snacks ± SEM, and Table 3 for significant differences between eating contexts (estimated difference ± SEM). For significant differences between snack types, for a given eating context: * signifies that sweet, low energy-dense portions are larger than for all other snacks types; § signifies higher than sweet, high energy-dense snacks; # signifies higher than salty, high energy-dense. See the matrix below the graph for significant differences between eating contexts for a given snack type. In the matrix, letters indicate highest to lowest (A→C) with non-significant differences sharing the same letter.
