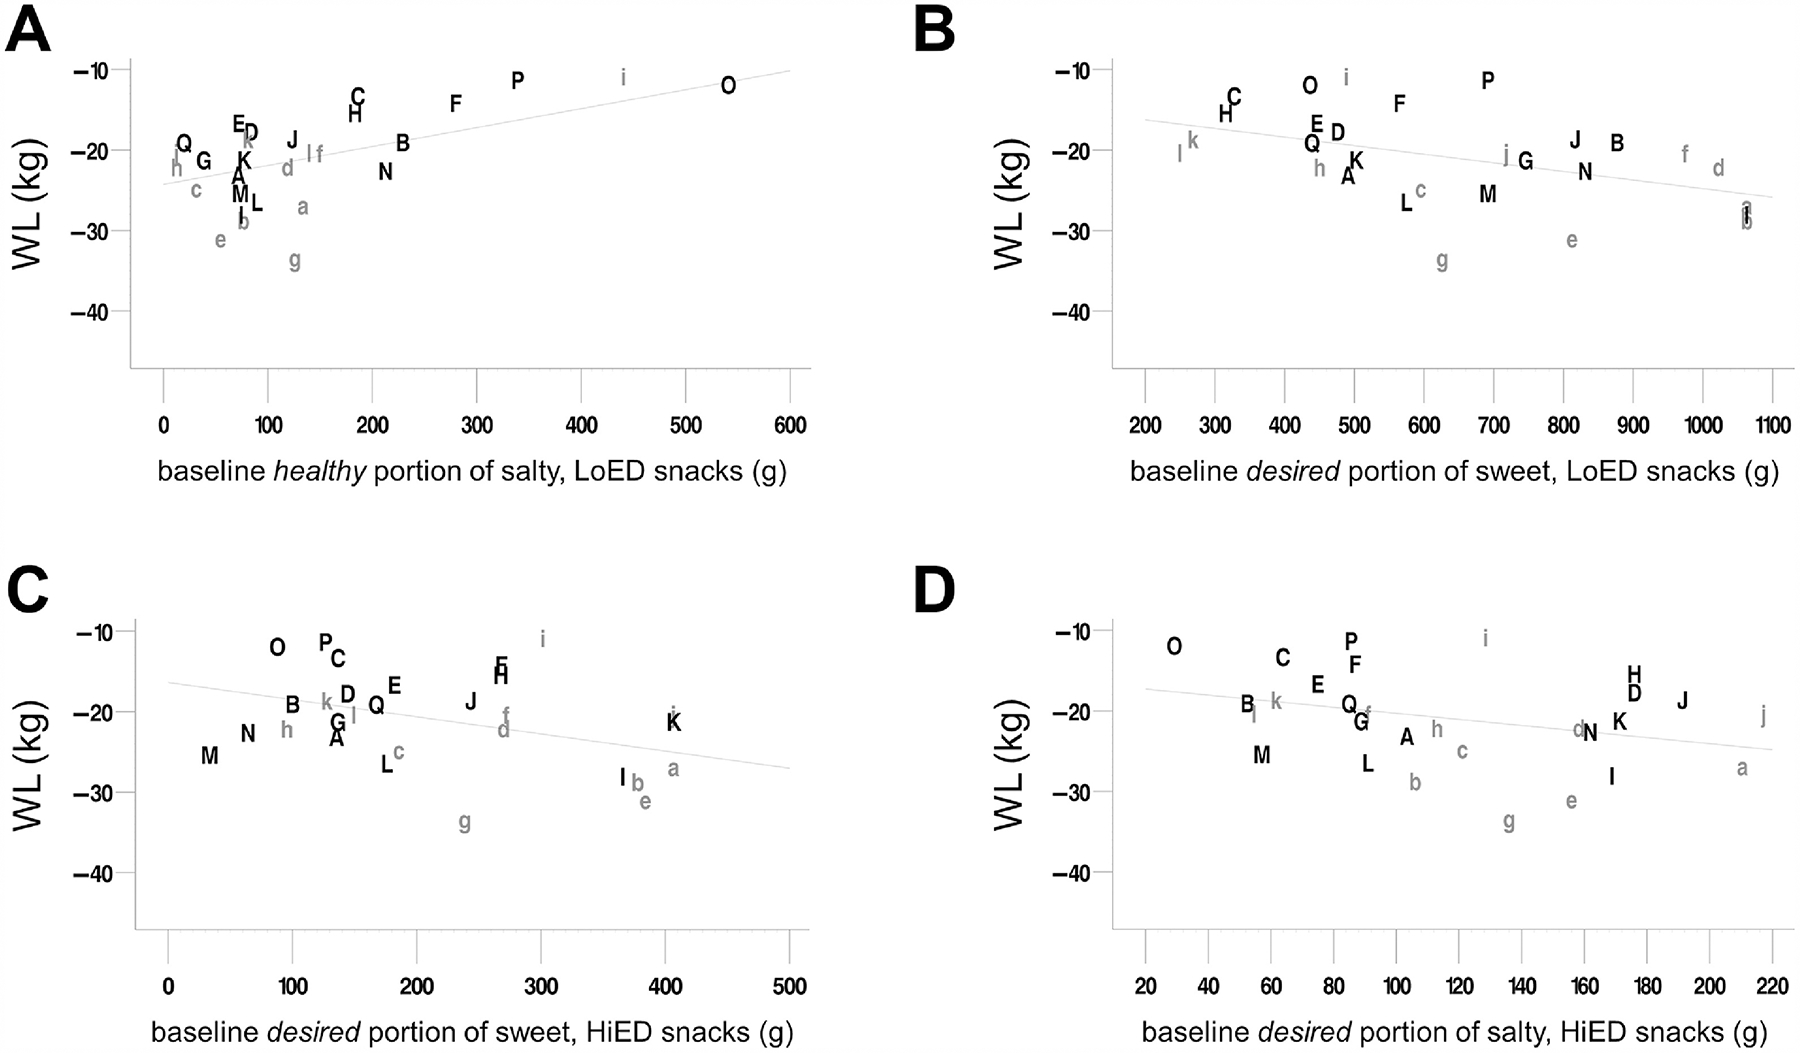
Figure 5. Weight loss regressions in patients.

Regressions of body weight loss (kg) at 3 months, in patients (n = 29), from baseline healthy portions of (A) salty, low-energy-dense snacks and desired portions of (B) sweet, high-energy-dense snacks, (C) sweet, low-energy snacks, and (D) salty, high-energy-dense snacks, with baseline weight (kg) as a covariate. Weight loss (kg) is baseline weight subtracted from 3-month weight. The ordinate axis goes from low weight loss (at the top) to highest weight loss (at the bottom). The regression line reflects the relationship between baseline portion and weight loss at mean initial weight (121.59 kg) in all patients. Each letter was assigned to a single participant and remains the same on each plot so that relative positions can be compared between plots. Grey, lowercase letters indicate that the participant underwent Roux-en-Y gastric bypass surgery, while black, uppercase letters indicate that the participant underwent vertical sleeve gastrectomy. See Supplemental Table 5 for regression statistics. WL, weight loss at 3 months; LoED, low energy-dense; HiED, high energy-dense
