
Figure 1. Power analyses.
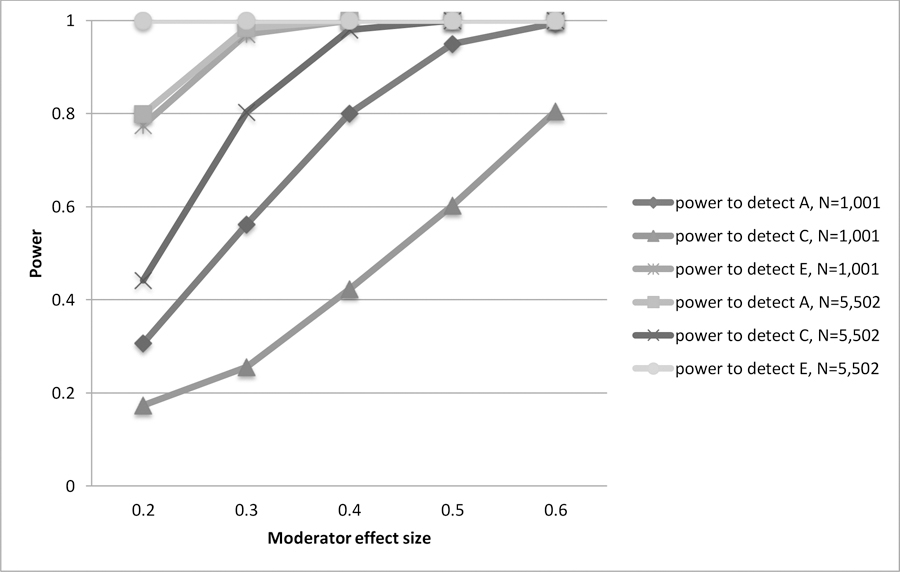
Note. We simulated data containing etiologic moderators of varying magnitude, from small (0.2) to large (0.6), in two sample sizes (N=1,001 pairs and 5,502 pairs). Our power to detect genetic (A), shared environmental (C), and non-shared environmental (E) moderators of varying sizes are indicated for each sample size, respectively. We assumed that our sample was 35% MZ and 65% DZ (the average across the various samples examined herein), and that a, c, and e path estimates were .72, .30, and .60, respectively.