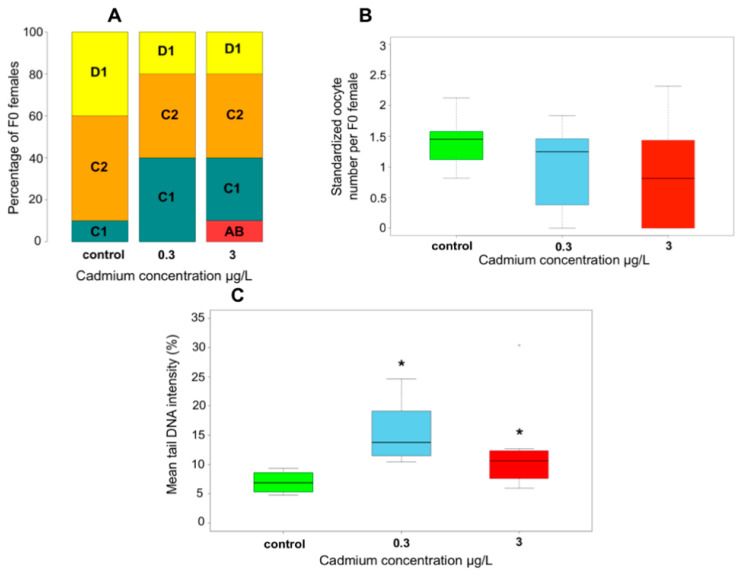
Figure 2.
F0 responses to Cd exposure. (A) Molt stage distribution of F0 females at the end of exposure, n = 10. (B) Oocyte production in F0 females (size-standardized oocyte number per female, n = 10). (C) Sperm DNA damages of F0 males (comet assay, mean tail DNA intensity), control: n = 9, 0.3 µg Cd/L: n = 8, 3 µg Cd/L: n = 8. Green, blue, and red colors in boxplots (B) and (C) correspond to control, 0.3 µg Cd/L, and 3 µg Cd/L, respectively; the boxes extend from the first to the third quartile of data distribution with a bold segment for the median value; the whiskers extend to the extreme data points (excluding outliers distant over 1.5 times the interquartile range from the median); star denotes a significant difference compared to the control condition (p-value < 0.05).

