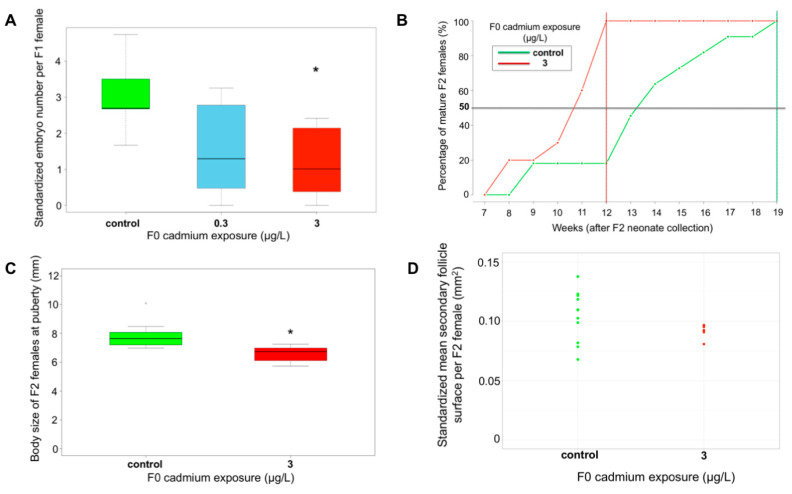
Figure 3.
Effects of F0 exposure on F1 and F2 reproductive capacity. (A) Embryo number per female in F1 generation (size-standardized embryo number), control: n = 9, 0.3 µg Cd/L: n = 7, 3 µg Cd/L: n = 8. (B) Dynamics of puberty during F2 generation (cumulative number of mature females/total female number), control: n = 11, 3 µg Cd/L: n = 10. (C) Body size of F2 female at puberty, control: n = 11, 3 µg Cd/L: n = 10. (D) Mean secondary follicle surface per F2 female, control: n = 11, 3 µg Cd/L: n = 7. Star denotes a significant difference compared to the control condition, p-value < 0.05.

