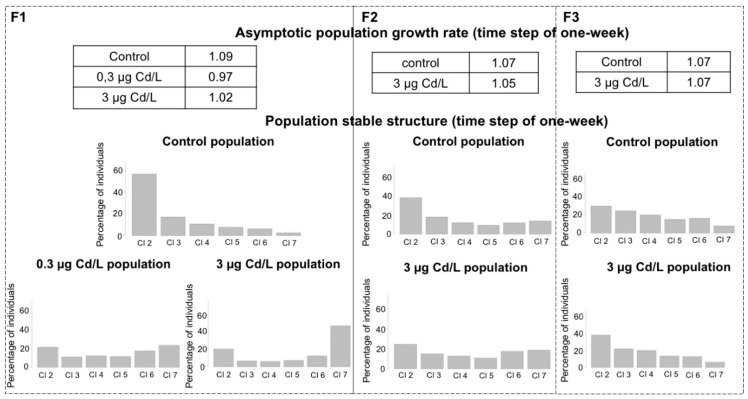
Figure 5.
Projection of population effects of F0 exposure. Demographic indicators (the asymptotic population growth rate and the population stable structure) were calculated for F1, F2, and F3 generations (time step of one-week). Cl = age class. Figure S1 presents the life cycle graph corresponding to the Lefkovitch model used for the calculation.

