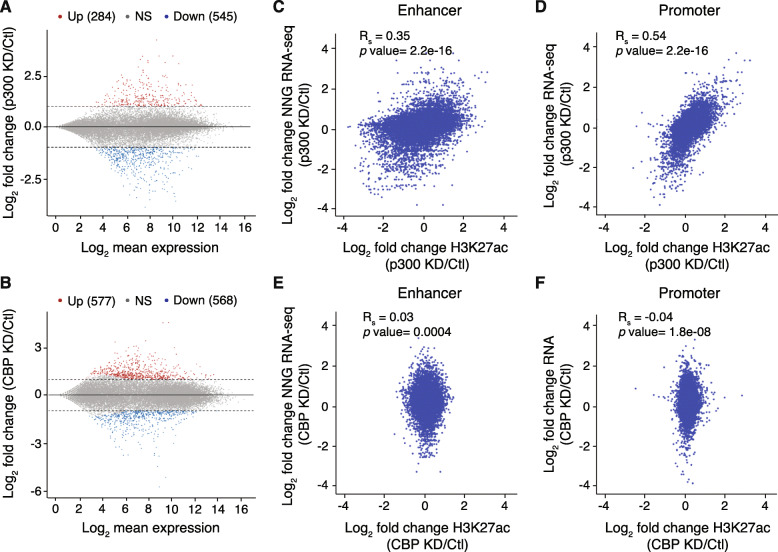
Fig. 3.
Reduced Levels of CBP and p300 Result in Unique Transcriptional Dysregulation. a, b MA plot of gene expression in Ctl and a p300 KD and b CBP KD mESCs. The x-axis indicates gene counts and the y-axis represents the log2(fold-change) in expression for KD versus Ctl mESCs. Dotted lines indicate fold-change > 2 and genes in blue and red were differentially expressed (p < 0.05). c, e Correlation plot between enhancer H3K27ac ChIP-seq and nearest-neighboring gene (NNG) RNA-seq for c p300 KD and e CBP KD represented as log2(fold-change) versus Ctl. d, f Correlation plot between promoter H3K27ac ChIP-seq and RNA-seq of expressed genes (RPKM > 1) for d p300 KD and f CBP KD represented as log2(fold-change) versus Ctl. Spearman correlation tests were performed to determine statistical significance

