Figure 5.
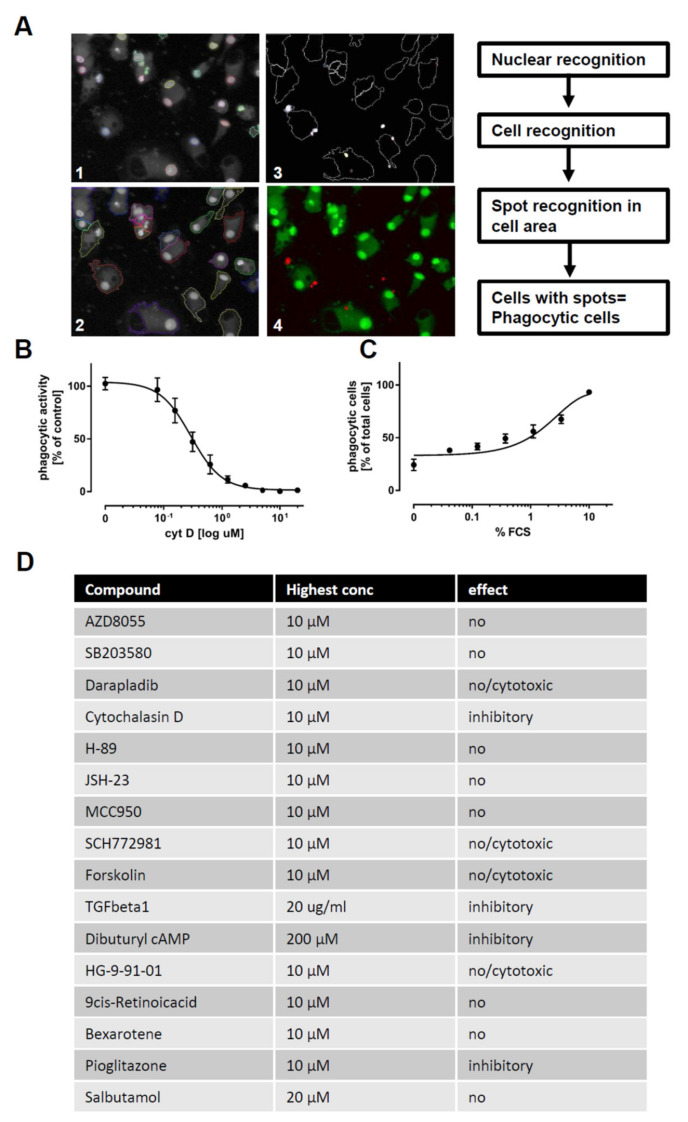
Modulators of phagocytosis: (A) Images of macrophages (M0) phagocytosing pHrhodo-labeled Zymosan (orange). Macrophages were stained using viability dye calcein-AM (green) and H-33342 (blue) for schematic depiction of quantification workflow. (B) Dose-response curve of the inhibitory effect of cytochalasin D on phagocytosis: Values are normalized to the activity in the vehicle control. Phagocytosis was assessed using automated microscopy (Operetta, Perkin Elmer) and image evaluation (Harmony, Perkin Elmer) (n = 3). (C) Dose-dependent increase in phagocytosis, mediated by bovine serum opsonization: Depicted as percentage of phagocytic cells relative to total cell count. Phagocytosis was assessed using automated microscopy (Operetta, Perkin Elmer) and image evaluation (Harmony, Perkin Elmer) (n = 3). (D) Tabular summary of the 16 tested tool compounds: Compound name, highest used concentration, and outcome classification are indicated in the table. Phagocytosis was assessed using automated microscopy (Operetta, Perkin Elmer) and image evaluation (Harmony, Perkin Elmer). iPSC-derived macrophage progenitors and macrophages were derived from SFC840-03-01 (STBCi026-B).

