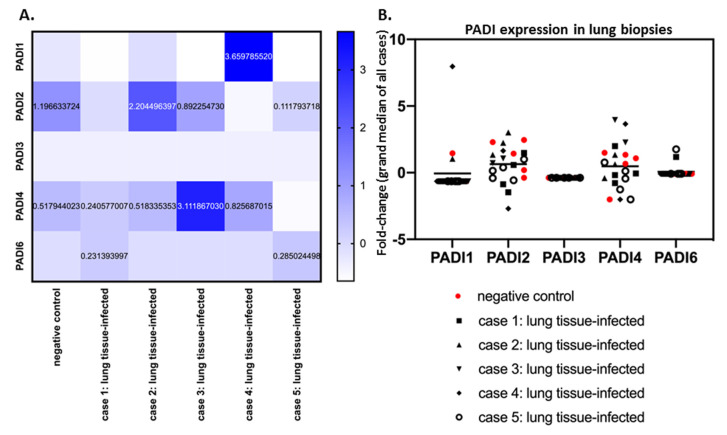
Figure 2.
PADI 1-6 isozyme expression levels in SARS-CoV-2-infected lung biopsies, and control lung tissue. (A) PRJNA631753 Bioproject data were analysed according to fold change for PADI1, PADI2, PADI3, PADI4 and PADI6 mRNA levels. Average data from control and SARS-CoV-2-infected lung tissue types are presented with a heat map. (B) The fold change for mRNA expression levels for each PADI is presented for each case and replicate via grand median distribution of data. Negative control (normal lung samples) and SARS-CoV-2 lung samples were from 5 different cases, with at least 3 replicate biopsy results for lung tissue.

