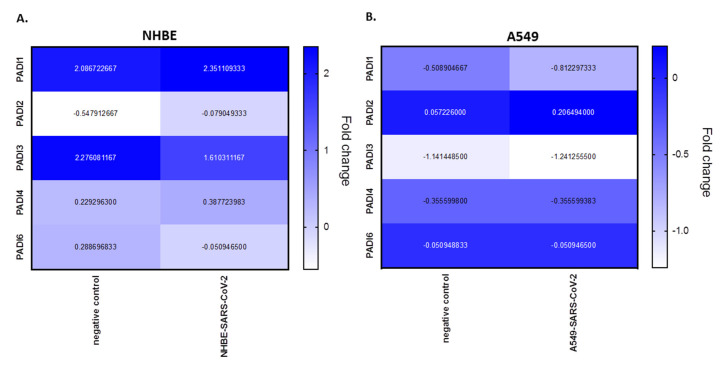
Figure 3.
PRJNA615032 BioProject data was analysed for fold change expression for PADI mRNA levels in SARS-CoV-2-infected cell lines, compared with mock. (A) NHBE (human bronchial epithelial) cell lines; (B) A549 (adenocarcinoma human alveolar basal epithelial) cell lines. Heat map metric is given as blue bar between normalised mRNA levels; negative control represents the mock.

