Fig. 6.
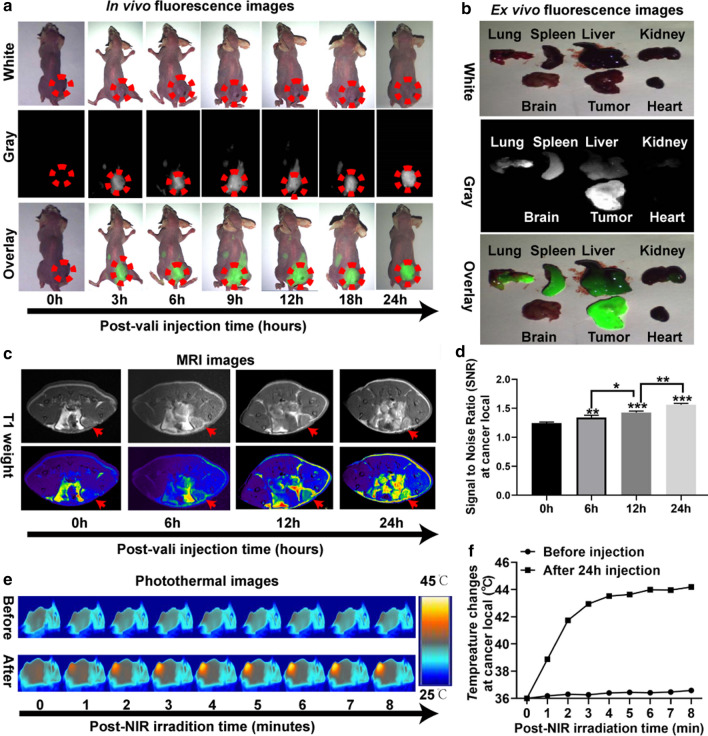
In vivo multi-mode imaging behaviors of HMON@CuS/Gd NPs HGC-27 cells. a In vivo fluorescence images of HGC-27 tumor bearing mice at 0, 3, 6, 12, 18 and 24 h after treatment with HMON@CuS/Gd. b Ex vivo Fluorescence image of major organs on mice. c, d In vivo MRI images of HGC-27 tumor bearing mice at 0, 6, 12 and 24 h after treatment with HMON@CuS/Gd, and the statistial signal to noise ratio (SNR) at cancer region. c, d In vivo MRI images of HGC-27 tumor bearing mice at 24 h after treatment with HMON@CuS/Gd (c; left), and the statistical signal to noise ratio (SNR) at cancer region (d; right). e, f In vivo IRT images of HMON@CuS/Gd-treated HGC-27 tumor bearing mice at different time, ranging from 0 to 8 min with NIR irradiation (e; left), and the statistical temperature change at cancer region (f; right)

