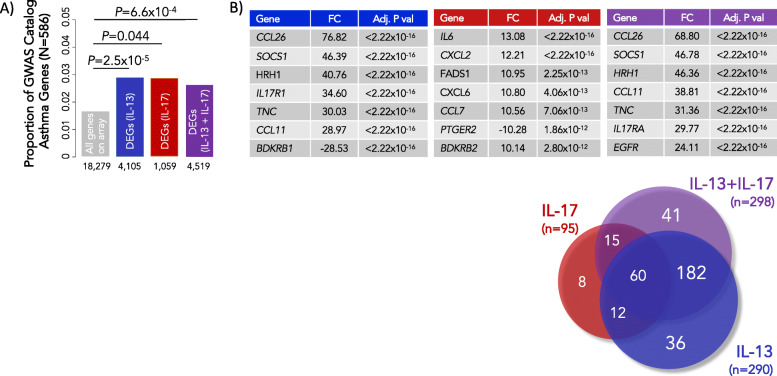
Fig. 2.
Asthma GWAS genes are over-represented among DEGs in response to IL-13 and/or IL-17A and among DEGs in cases compared to controls. In all panels, blue refers to IL-13 treated cells, red to IL-17A treated cells, and purple to IL-13+IL-17A treated cells. a DEGs following exposure to IL-13 and/or IL-17A were enriched for GWAS catalog genes near variants associated with asthma (N = 586) compared to all non-DEGs on the array. The numbers of DEGs for each exposure are shown on the X-axis, and the proportions of GWAS genes are shown on the Y-axis. b The 8 most significant DEGs are listed. The Venn diagram illustrates the total numbers and overlaps of DEGs that are also near SNPs highlighted in asthma GWASs

