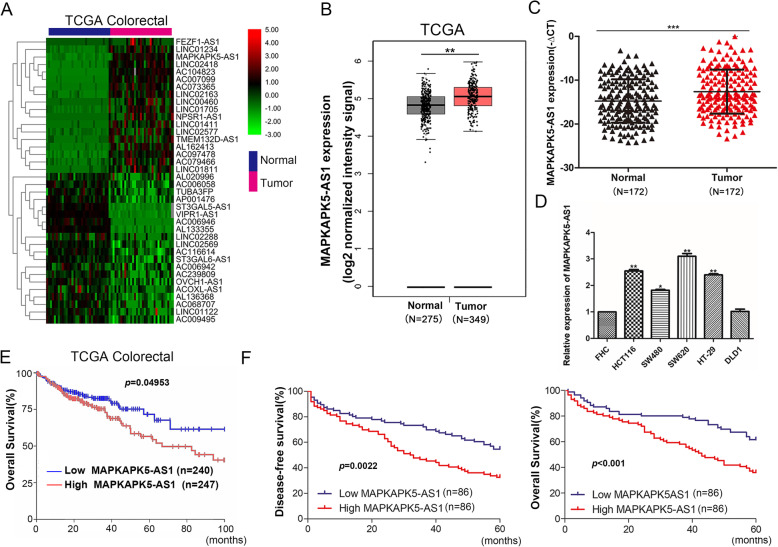
Fig. 1.
MK5-AS1 was upregulated in CRC tissues. a. A Heatmap of RNA-Seq analysis of differentially expressed lncRNAs in CRC and corresponding normal tissues generated from RNA sequencing data from the TCGA database. Red in the heatmap denotes upregulation, green denotes downregulation. b. Expression of MK5-AS1 in the TCGA CRC cohort. c. qPCR was utilized to analyze the MK5-AS1 expression in 172 pairs of CRC tissues and corresponding adjacent non-tumoral tissues. d. Expression of MK5-AS1 was detected by qPCR in the normal colorectal epithelium cell line (FHC) and CRC cell lines. e. Kaplan-Meier overall survival was analyzed according to MK5-AS1 expression in TCGA cohort. f. Kaplan-Meier overall survival and relapse-free survival curves according to MK5-AS1 expression in our cohort. *P < 0.05, **P < 0.01 and ***P < 0.001

