Fig. 5.
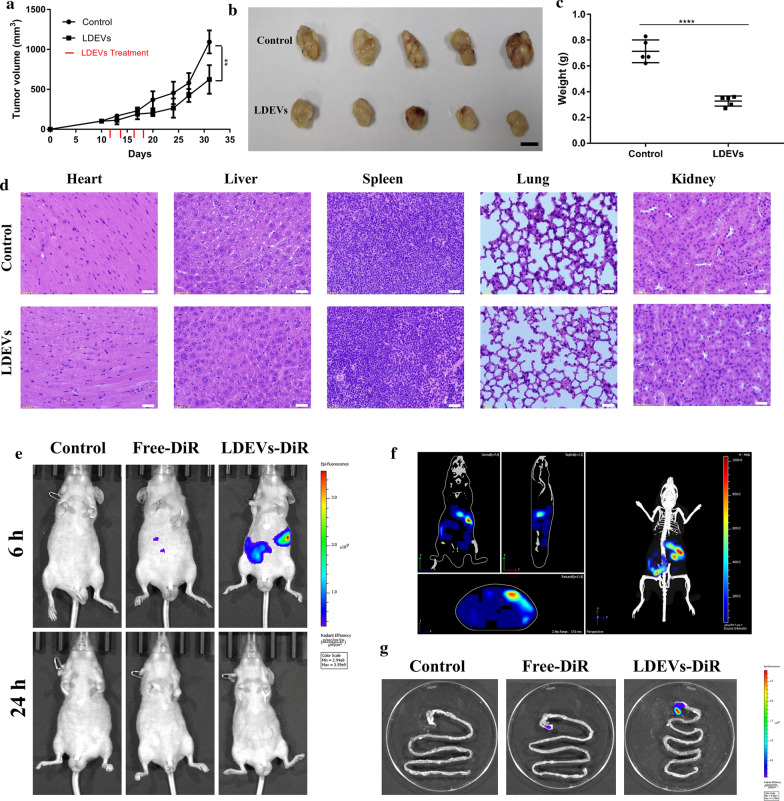
Gastric cancer growth suppression and the distribution of LDEVs in gastrointestinal organs. a Tumor growth curve of the control and LDEVs treatment groups; b Representative images of SGC-7901 tumors. Scale bar = 1 cm. c Quantification analysis the weight of SGC-7901 tumors of control and LDEVs treatment group (**p < 0.01; ****p < 0.0001) (Scale bar = 20 μm); d Representative H&E stained histological images of major organs sections; e Nude mice were intragastric injection with electrophoretic buffer, free-DiR or LDEVs-DiR in a volume of 50 μL electrophoretic buffer. Mice were imaged at 6 h and 24 h post-injection. f The organs of a mouse from LDEVs-DiR group were reconstructed at 6 h; g Gastrointestinal organs were excised and imaged after 24 h. A scale of the radiance efficiency presented in the right of images

