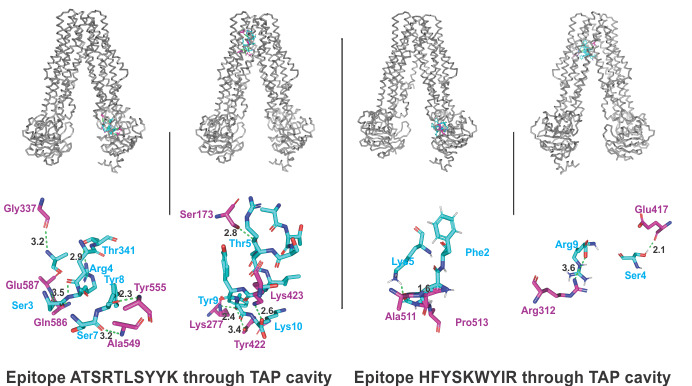
Figure 2.

Molecular docking analysis of two CTL epitopes within the TAP transporter cavity. The molecular interactions of the CTL epitopes (cyan sticks) within the TAP cavity (gray ribbons/sticks) are shown. Detailed interactions between the residues of the epitopes and the TAP transporter residues are shown, with hydrogen bond formation indicated with green dots. H bonds are shown in green dots with lengths in angstroms. TAP: transporter associated with antigen processing.
