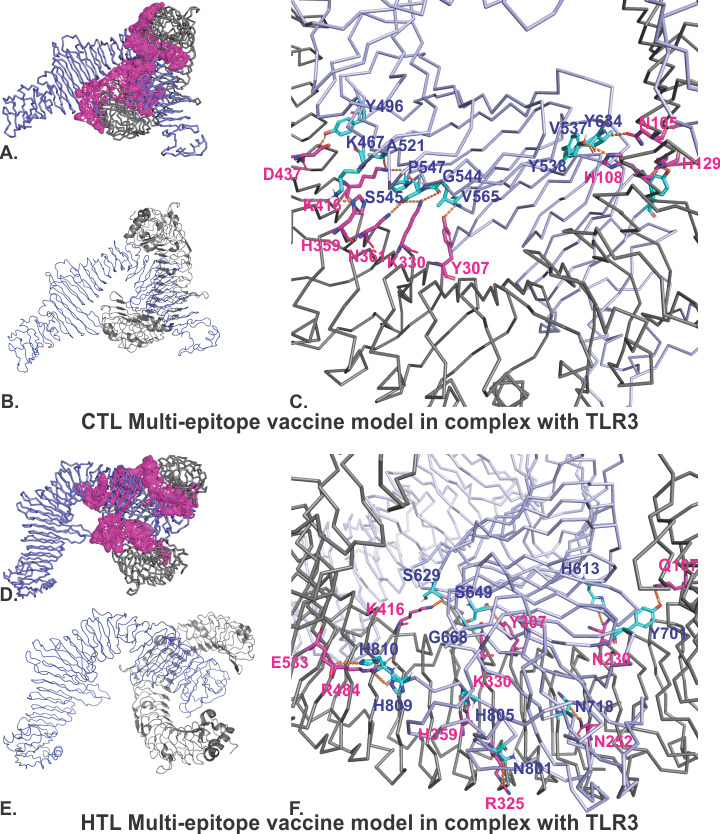
Figure 4.

Molecular docking studies of the CTL and HTL MEVs with TLR3. (A), (D): The docking complexes of CTL-TLR3 and HTL-TLR3 with patches on the TLR3 receptor indicating the region of binding sites calculated by PDBsum [60]. (C), (F): Detailed molecular interactions between the binding site residues of the CTL and HTL MEVs and TRL3 (CTL, HTL: cyan; TLR3: magenta). Hydrogen bond formation is shown by orange dotted lines. (B), (E): B-factors of the docked MEVs to the TLR3 receptor. The presentation is in VIBGYOR color, with blue showing a low B-factor and red showing a high B-factor. Most of the MEV regions are blue, showing low B-factors; this indicates the formation of stable complexes with the TLR3 receptor. CTL, cytotoxic T lymphocyte. HTL, helper T lymphocyte. TLR3, toll-like receptor 3.
