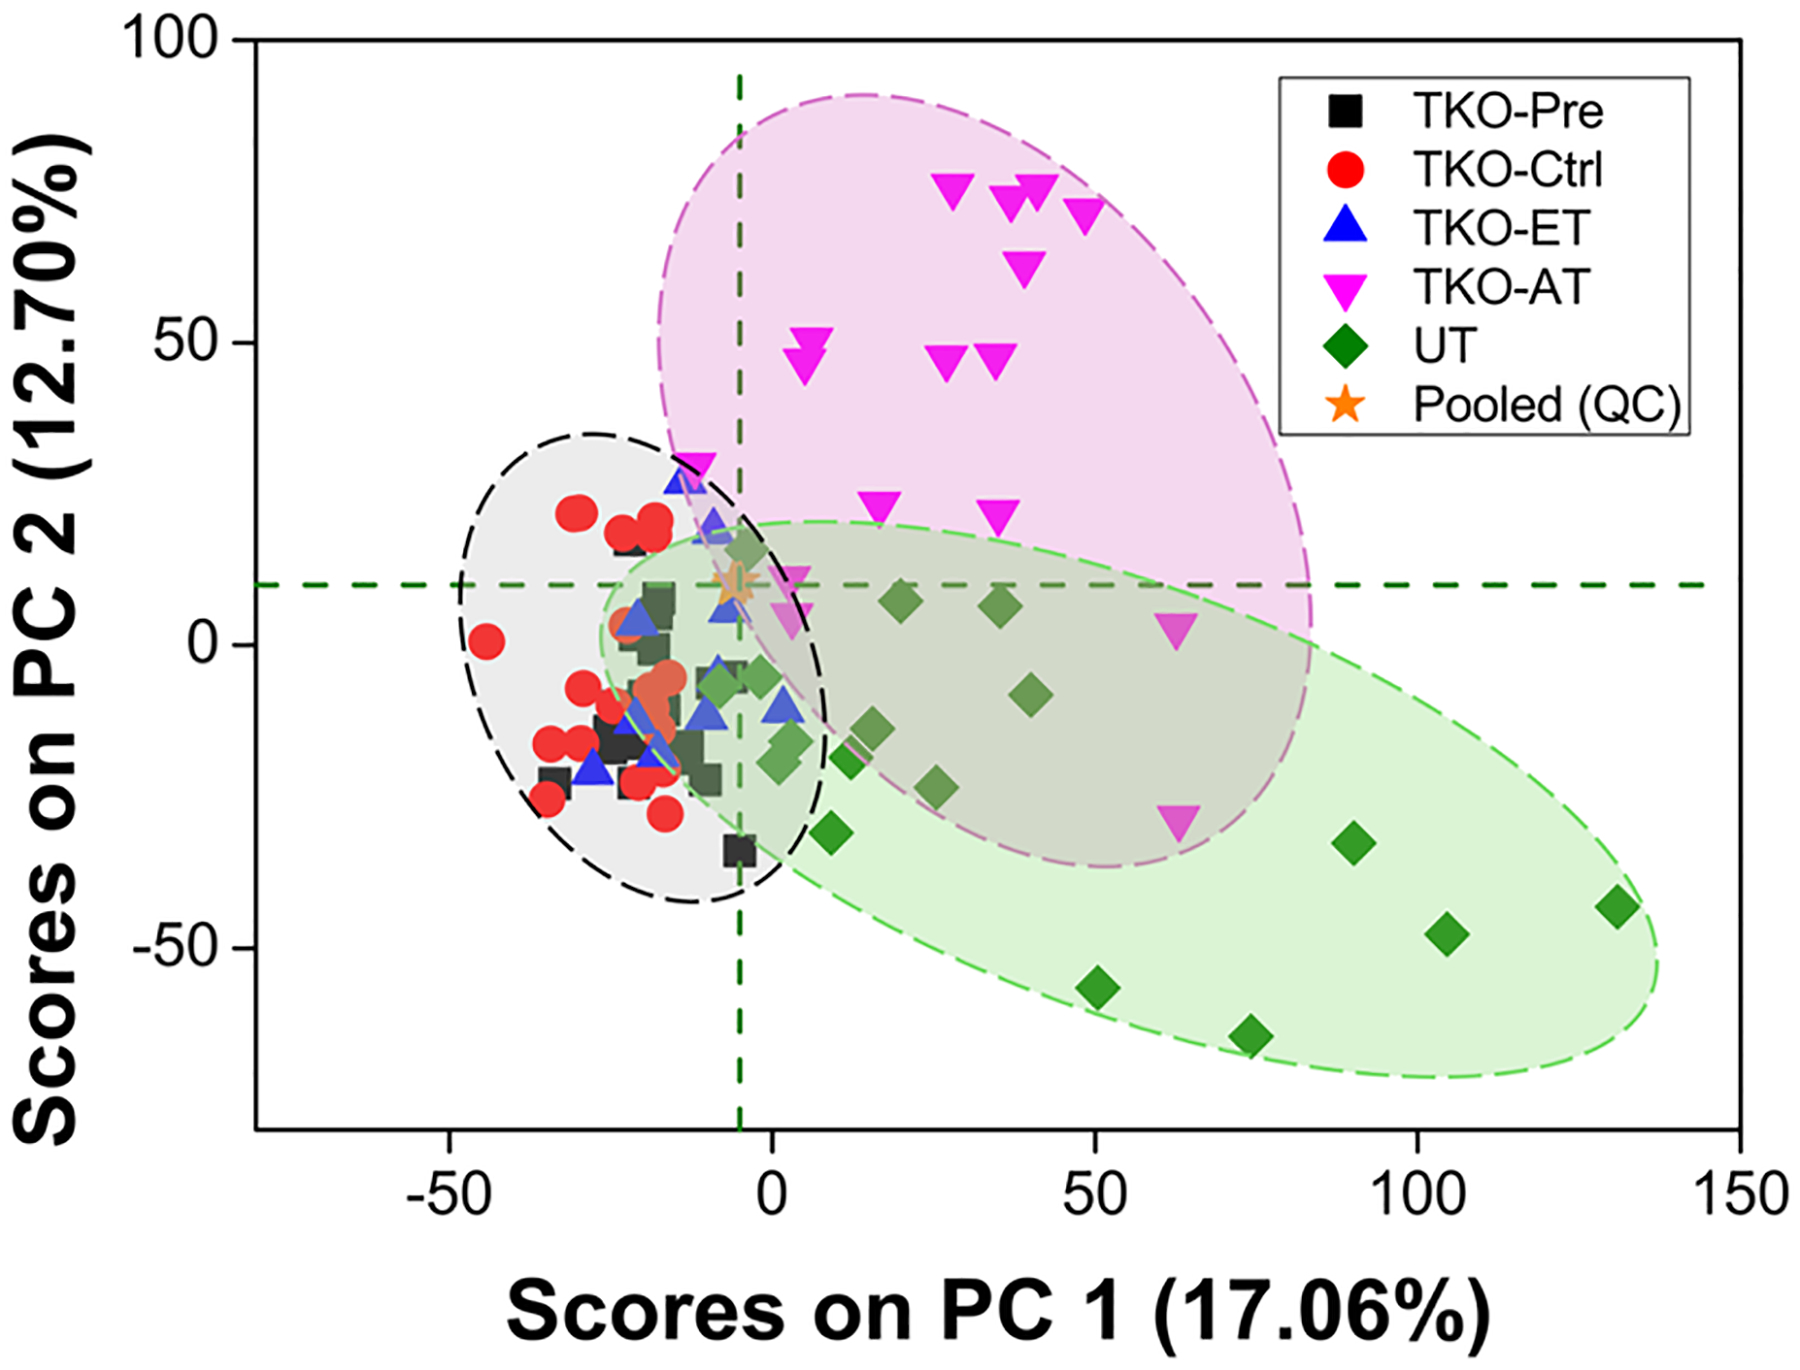
Figure 1.

PCA score plot including all sample groups using the total initial set of 5937 spectral features. The clustering of samples in this plot reveals clear separation between TKO-ET mice from TKO-AT mice and UT mice, a moderate separation between TKO-ET mice and TKO-Ctrl mice with some overlap, and complete overlap of TKO-Pre and TKO-Ctrl mice. Pooled QC samples, represented by orange stars, clustered toward the center of the plot, indicating that the technical variance was minimal.
