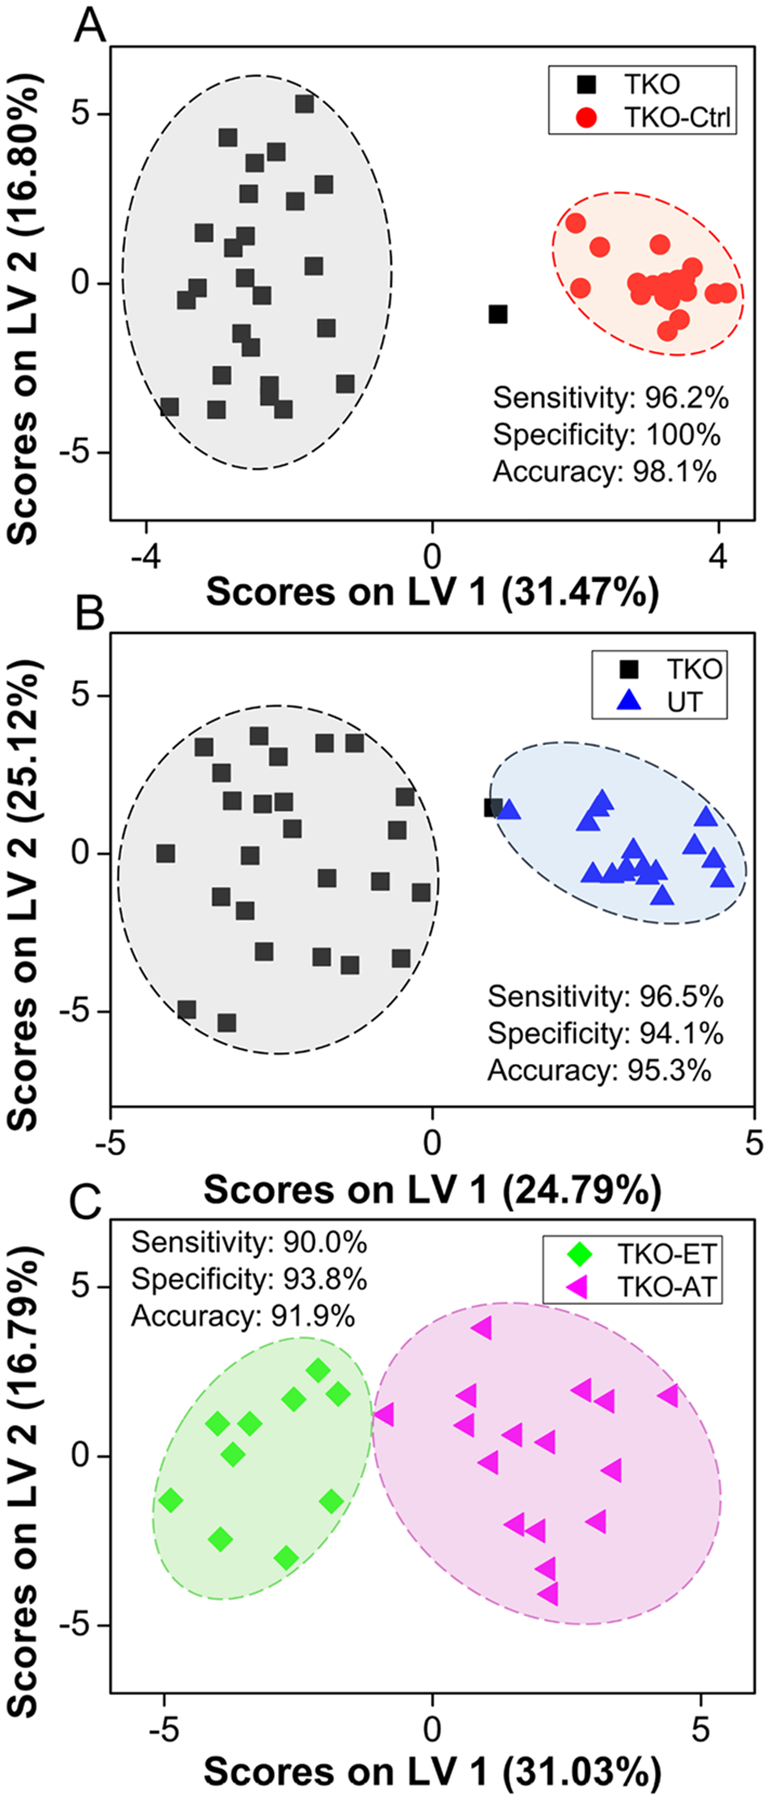
Figure 3.

oPLS-DA scores plot depicting clustering of samples between (A) TKO and TKO-Ctrl samples, (B) TKO and UT samples, and (C) TKO-ET and TKO-AT samples using the 29-feature panel. Variance between classes is captured across the x-axis. TKO, TKO-Ctrl, UT, TKO-ET, and TKO-AT samples are represented by black squares, red circles, blue triangles, green diamonds, and pink triangles, respectively. Cross-validated sensitivity, specificity, and accuracy values are given for each model. TKO samples are TKO-ET and TKO-AT samples combined.
