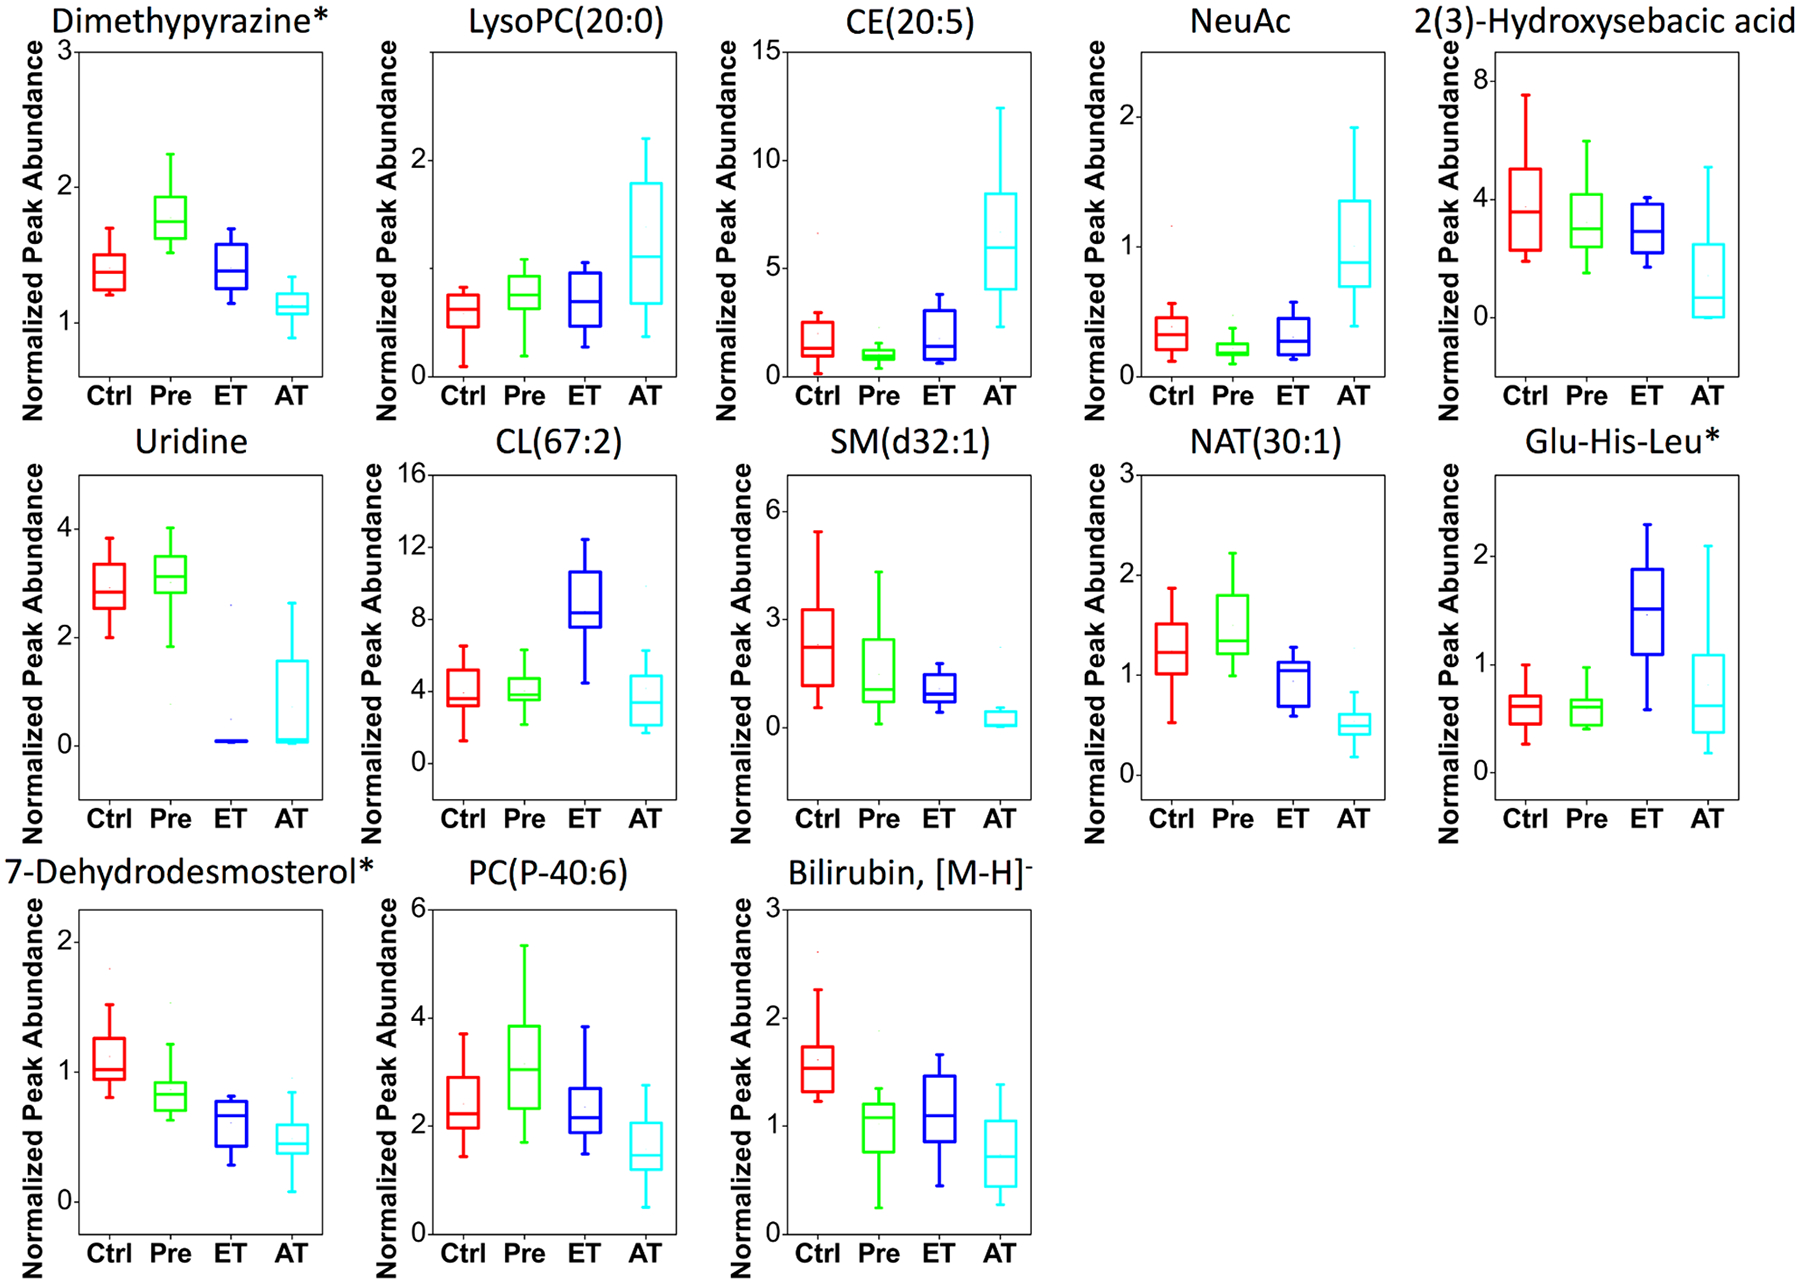
Figure 5.

Box plots showing changes of the selected identified metabolites in Ctrl (n = 19), Pre (n = 22), ET (n = 10), and AT (n = 16) samples. The mean, median, upper and lower quartiles, outliers, and minimum and maximum (whiskers) values are displayed. *Features have isomers.
