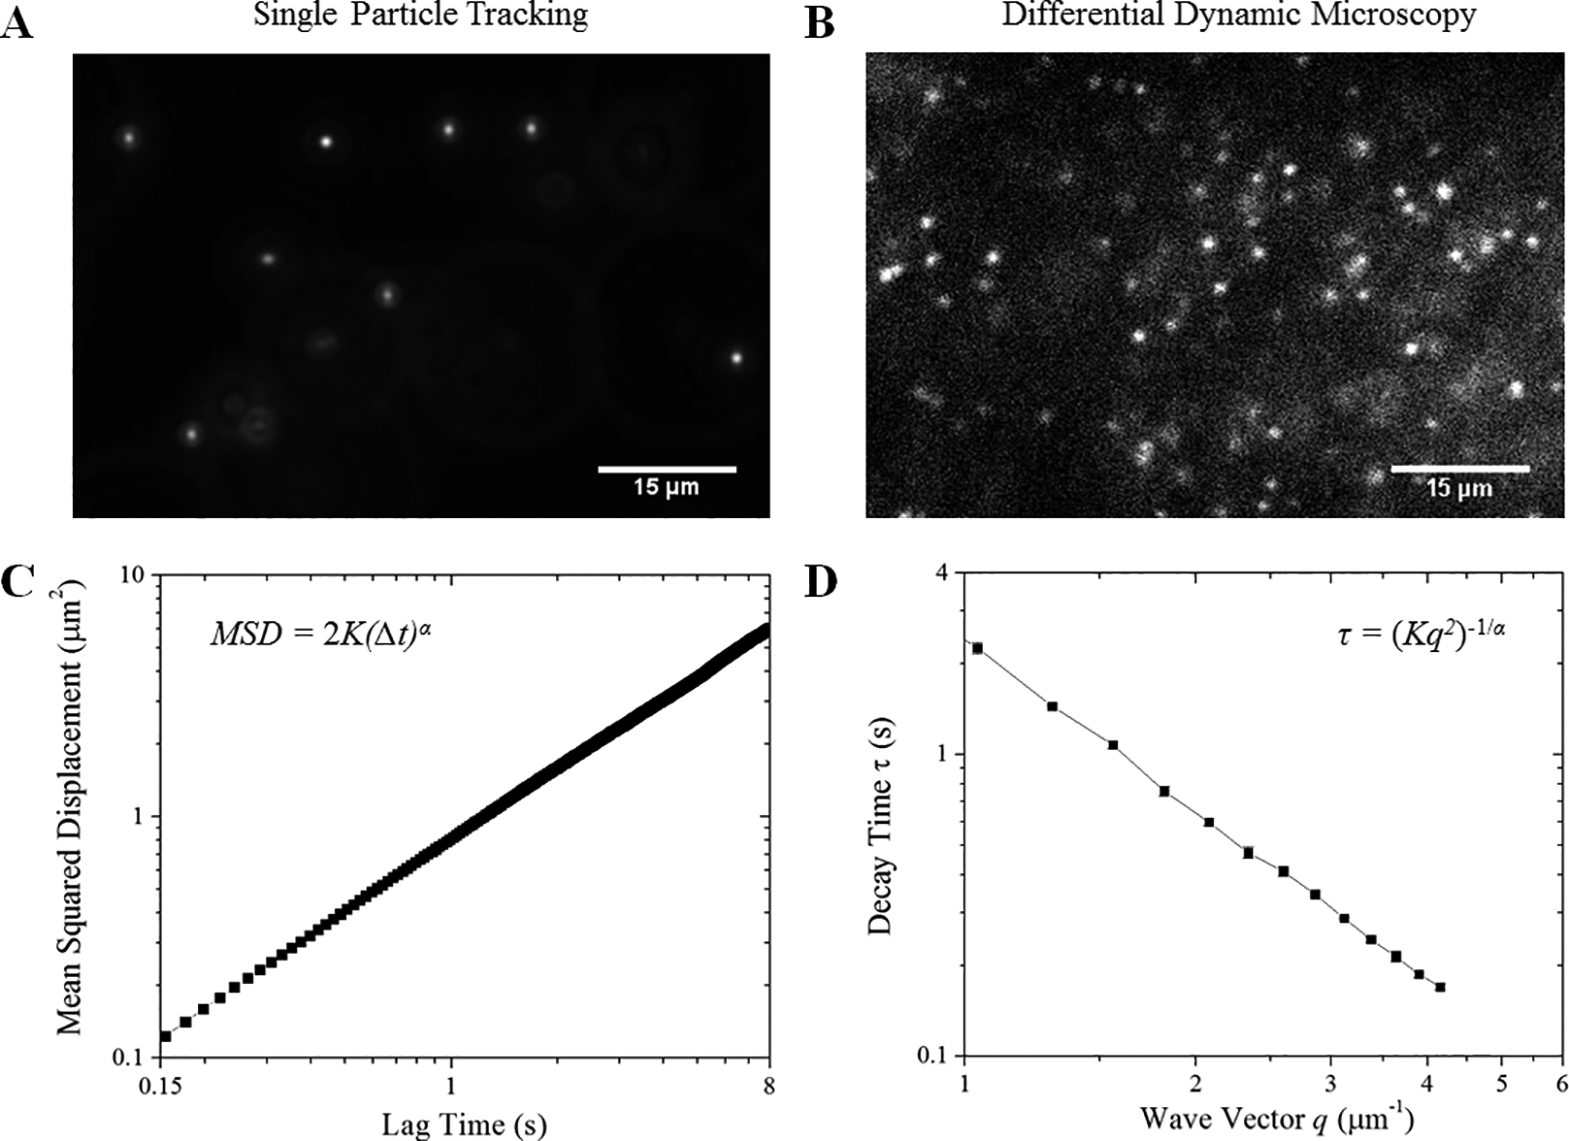
Figure 1: We employ two complementary techniques to quantify the transport dynamics of micro-particles in actin-microtubule composites.

Fluorescent 1-μm-diameter microspheres diffusing in cytoskeleton composites are imaged using (A) widefield fluorescence microscopy and (B) light-sheet microscopy and analyzed using (C) single-particle tracking (SPT) and (D) differential dynamic microscopy (DDM). (A) For SPT, 400-frame videos with ~75 particles in view are acquired at 45 fps and used to determine the trajectories of individual tracers. (B) For DDM, 5000-frame videos with ~1000 particles in view are acquired at 4 to 40 fps, and used to determine ensemble transport properties. (C) For SPT, the mean-squared displacement (MSD) of diffusing particles is plotted versus lag time (Δt). We fit the MSD to the power law function MSD = 2K(Δt)α, producing the transport coefficient (K) and scaling exponent (α). (D) The characteristic decay times (τ) of density fluctuations over spatial scales of 2μ/q are plotted versus the magnitude of the wave vector q. We fit our data to the function τ = (Kq2)−1/α to extract the transport coefficient (K) and scaling exponent (α). Data shown in C and D are for particles diffusing in buffer.
