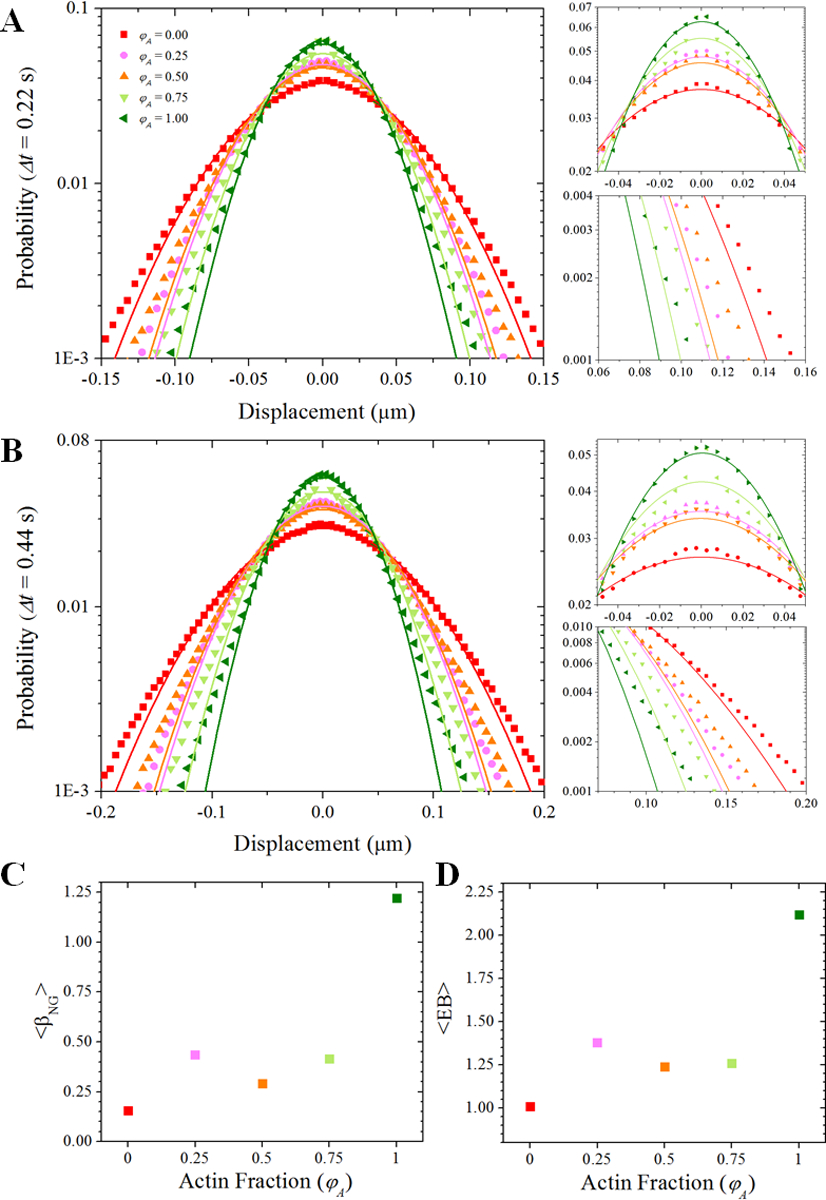
Figure 4. Tracers in cytoskeleton composites exhibit non-Gaussian anomalous diffusion.

(A,B) Probability distributions of particle displacements for each φA (color-coded symbols) for lag times of (A) 0.22 seconds (10 frames) and (B) 0.44 seconds (20 frames). Color-coded solid lines are fits to a Gaussian function for each distribution. For the PDFs shown in (A) and (B), we zoom-in on the peaks and tails of the distributions in the plots to the right. These plots highlight the poor fitting to a normal distribution, a signature of anomalous diffusion. The higher than expected probability of near-zero displacements suggests that tracers are being trapped or caged in the networks. The long non-Gaussian tails (i.e., more large displacements than expected) are suggestive of hopping events. (C) The non-Gaussianity parameter is greatest for φA = 1 and least for φA = 0. However, between φA = 0.25 and φA = 0.75 we see relatively little change in the non-Gaussianity. (D) The same trend observed with the non-Gaussianity parameter is seen with the ergodicity breaking parameter.
