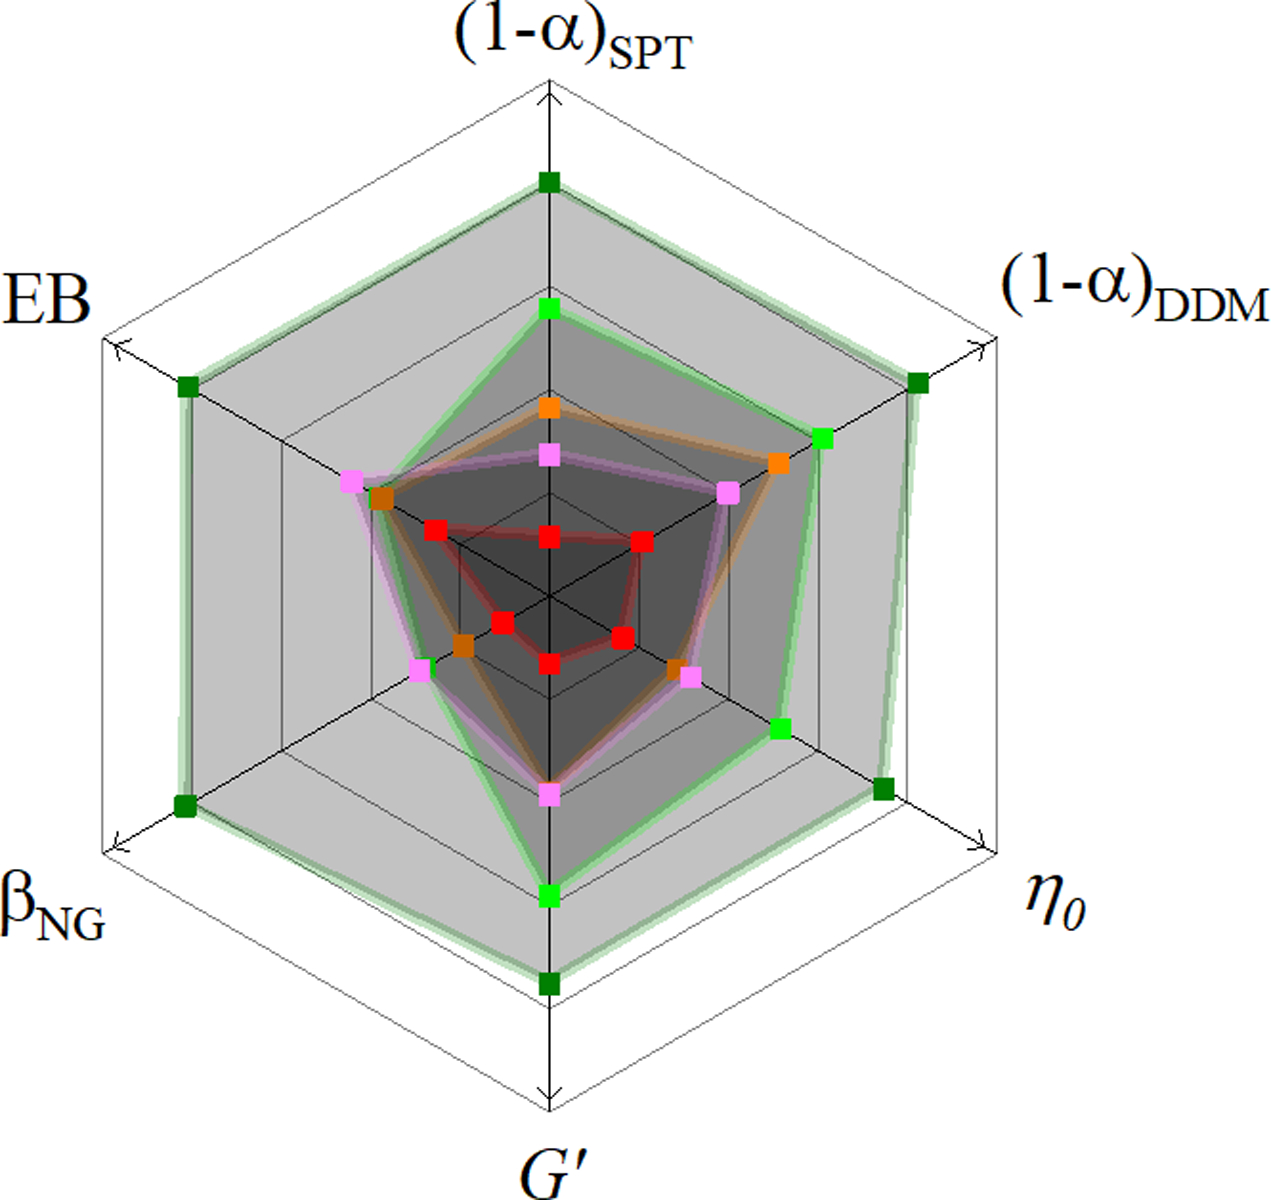
Figure 6. Using multiple metrics to quantify anomalous subdiffusion showcases the role that both mesh size and polymer stiffness have on determining the degree of anomalous subdiffusion.

With the same color scheme used in previous figures we show how the various indicators of anomalous transport depend on the actin fraction of our composites. A greater distance from the center (in the direction of the arrows) signifies a greater degree of anomalous subdiffusion. Only for the scaling exponent α, measured either using SPT or DDM, do we observe a steady trend of increasingly anomalous transport with increasing actin fraction (and, therefore, decreasing mesh size). While all other indicators show a greater degree of subdiffusion in networks of purely actin filaments than in networks of purely microtubules, their values do not increase monotonically between φA = 0.25 and φA = 0.75 despite the fact that the mesh size ξ does. This result suggests that both the mesh size and the rigidity of the filaments comprising the network influences the transport properties.
