Figure 2.
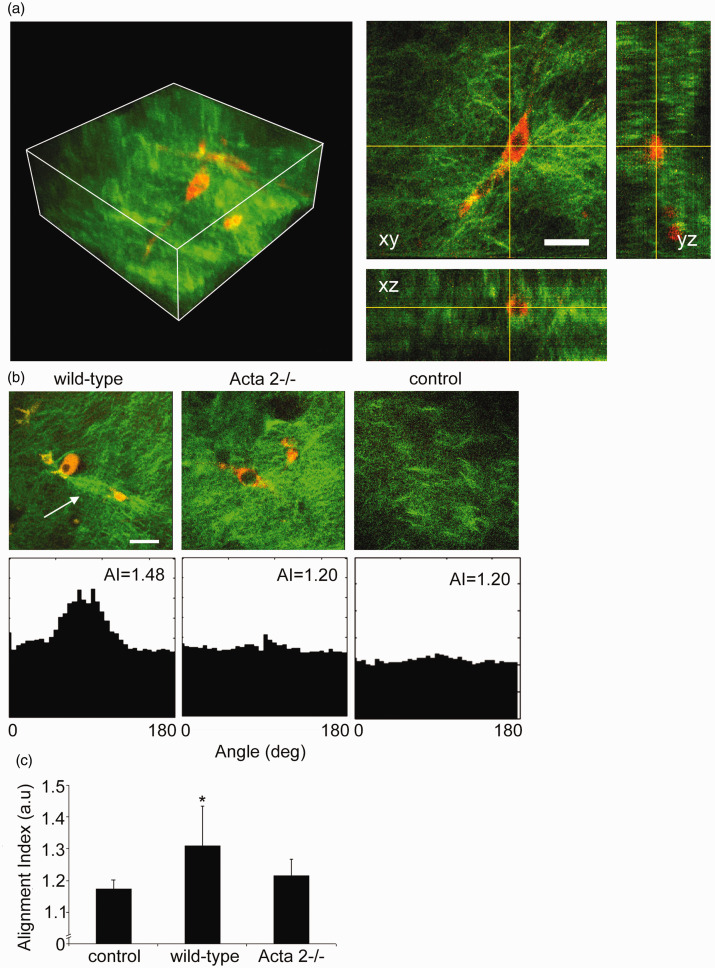
(a) Representative 3D image of cell-seeded collagen gel and 2D optical sections in xy, xz, and yz planes. Collagen was pseudo-colored in green (SHG signal), while SMCs were pseudo-colored in red (auto-fluorescence signal). (b) Representative 2D optical sections and their individual alignment angle distributions. Wild-type cells exert force on the collagen matrix inducing higher remodeling of the collagen fibers (see arrow), while Acta2−/− cells have reduced local matrix remodeling. (c) The distribution of collagen fiber orientation measured by the alignment index (AI) for WT cells shows a significant increase in respect to control (collagen gel without cells), while no change was recorded for Acta2−/− cells (n = 10–14 per condition). Scale bar represents 50 µm. Data shown as mean ± SD. *Significance was evaluated at P < 0.05.

