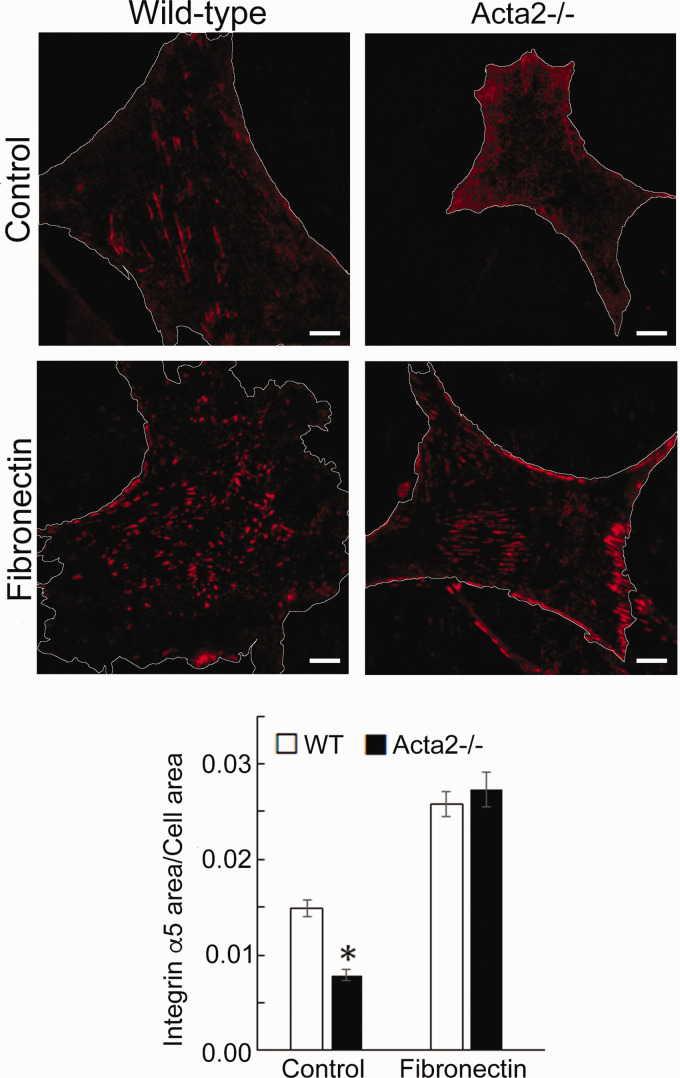
Figure 6.
(a) Representative TIRF images of integrin α5 in Acta2−/− and WT cells plated on different extracellular matrices. Scale bar represents 10 µm. Cell periphery is outlined with a white line. (b) Quantitative analysis of fluorescence images (n = 27–35 cells per condition). Data shown as mean ± SEM. *Significance was evaluated at P < 0.05. (A color version of this figure is available in the online journal.)

