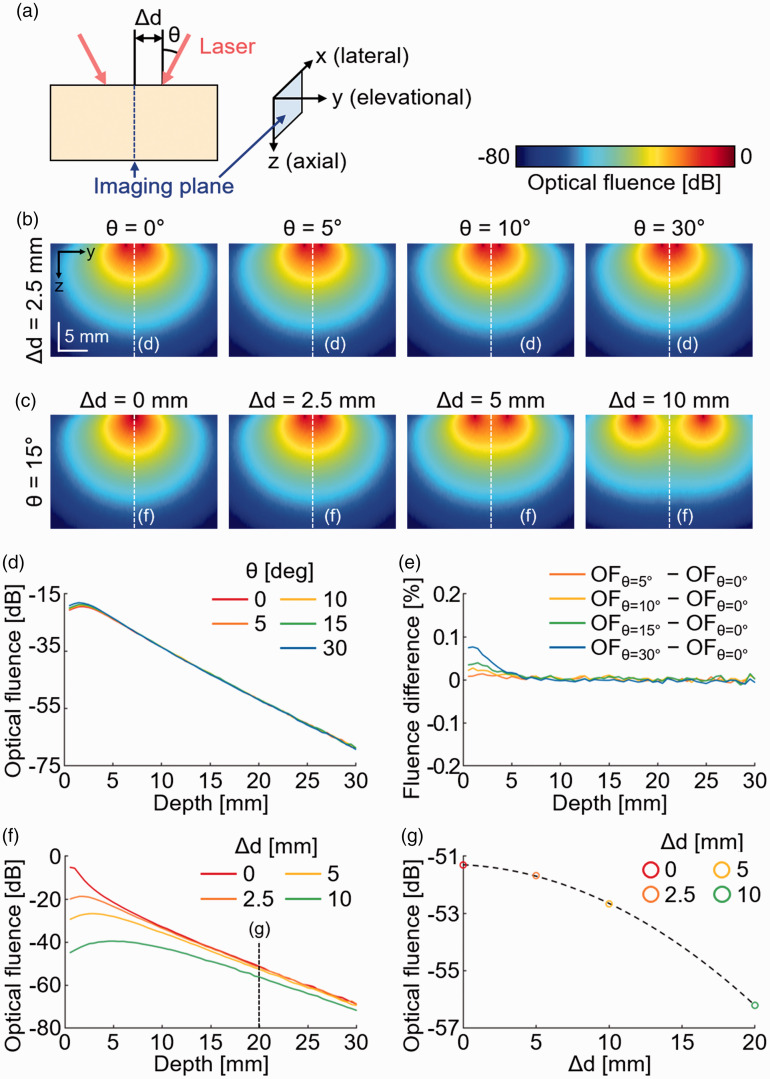
Figure 4.
Monte Carlo simulation of light propagation in biological tissues. (a) The illustration of the imaging plane and the incident laser beam. Monte Carlo simulation of optical fluence in biological tissues with the fixed distance (b) and fixed angle (c) of the two incident laser beam. (d) Optical fluence at the imaging plane with a fixed distance (5 mm) and various incident angles. (e) Percentile difference in optical fluence at each angle compared to optical fluence at the normal incident (θ = 0). (f), Optical fluence at the imaging plane with a fixed angle (15°) and various distances. (g) Optical fluence at the depth of 20 mm with the various distances between the laser beams. θ: the incident angle of the laser beam; Δd: the distance between two laser beams at the imaging surface; OF: optical fluence. (A color version of this figure is available in the online journal.)

