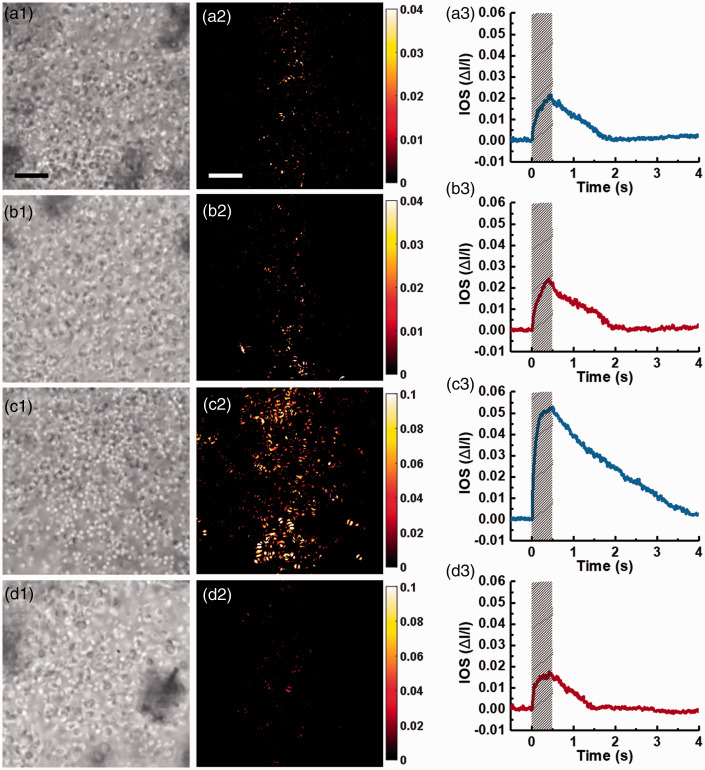
Figure 3.
Comparison of photoreceptor-IOS responses between WT and rd10 groups at P14 and P16. (a) Representative retinal images (left) and photoreceptor-IOS map obtained at 0.5 s (middle), and time course of mean photoreceptor-IOS magnitude (right), acquired from a WT mouse retina at P14. (b) Representative results acquired from a rd10 mouse retina at P14. (c) Representative results acquired from a WT mouse retina at P16. (d) Representative results acquired from an rd10 mouse retina at P16. Scale bars represent 10 μm. Shaded areas indicate stimulus duration. (A color version of this figure is available in the online journal.)

