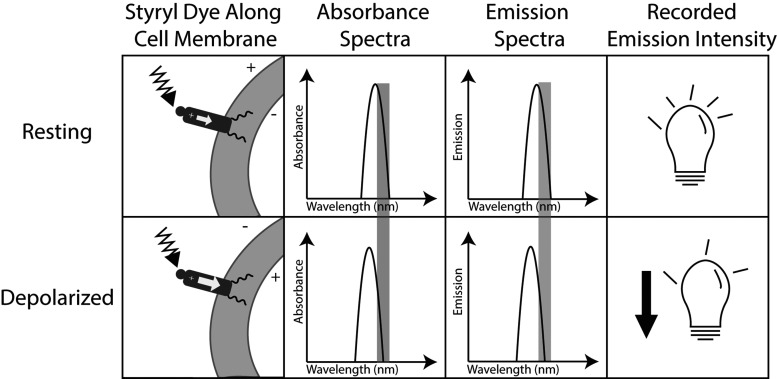
Figure 1.
Schematic mechanism of dye voltage sensitivity. Column 1: fluorophores orient parallel to the membrane potential. When the fluorophore is excited by absorbing a photon, a positive charge moves across the molecule. This requires a higher energy photon when the cell is depolarized because the fluorophore’s excited state is no longer stabilized by the membrane potential. Column 2: because more energy is required to excite the fluorophore when cells are depolarized, the absorbance spectrum shifts to the left (shorter, more energetic wavelengths). The wavelength of excitation light is often chosen to lie on the right flank of the absorbance spectrum. Therefore, when the spectrum shifts, less excitation light is absorbed by the stained tissue. Column 3: the Stokes shift is fixed, so the emission spectrum also shifts to shorter wavelengths when cells are depolarized. The band of emission light that is recorded is also typically chosen to lie on the right flank of the emission spectrum. Column 4: because both absorbance and emission spectra shift “out from under” the respective excitation and emission bands, less light reaches the photodetector during depolarization. A fluorescence signal recorded from a single site will therefore have inverted action potentials.

