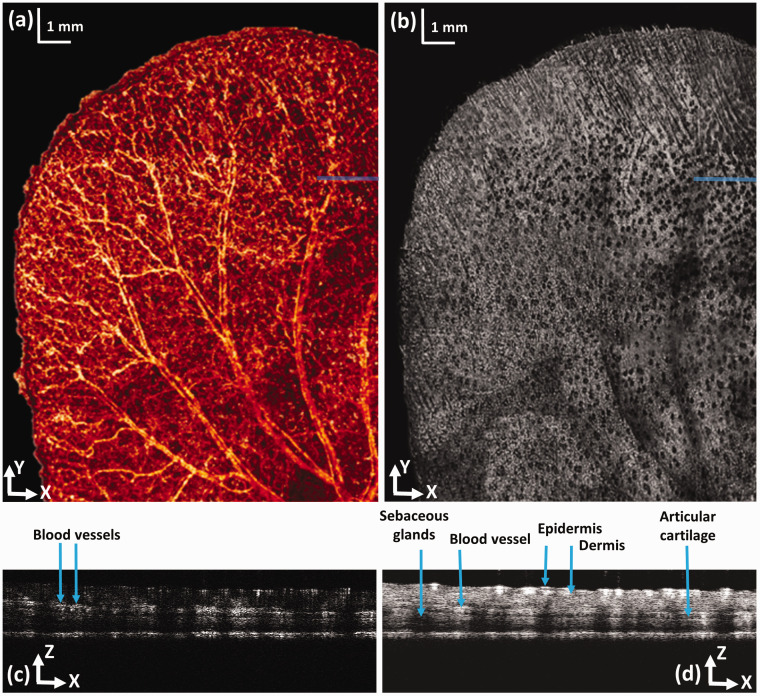
Figure 2.
OCTA image of a mouse ear. (a) En face projection of the OCTA image; (b) OCT projection image generated from the acquired 3D OCT dataset; (c) Cross-sectional OCT blood flow image at the location marked in panel (a) by a solid line; (d) OCT B-scan at the location marked in panel (b) by a solid line; bar; 1 mm. (A color version of this figure is available in the online journal.)

